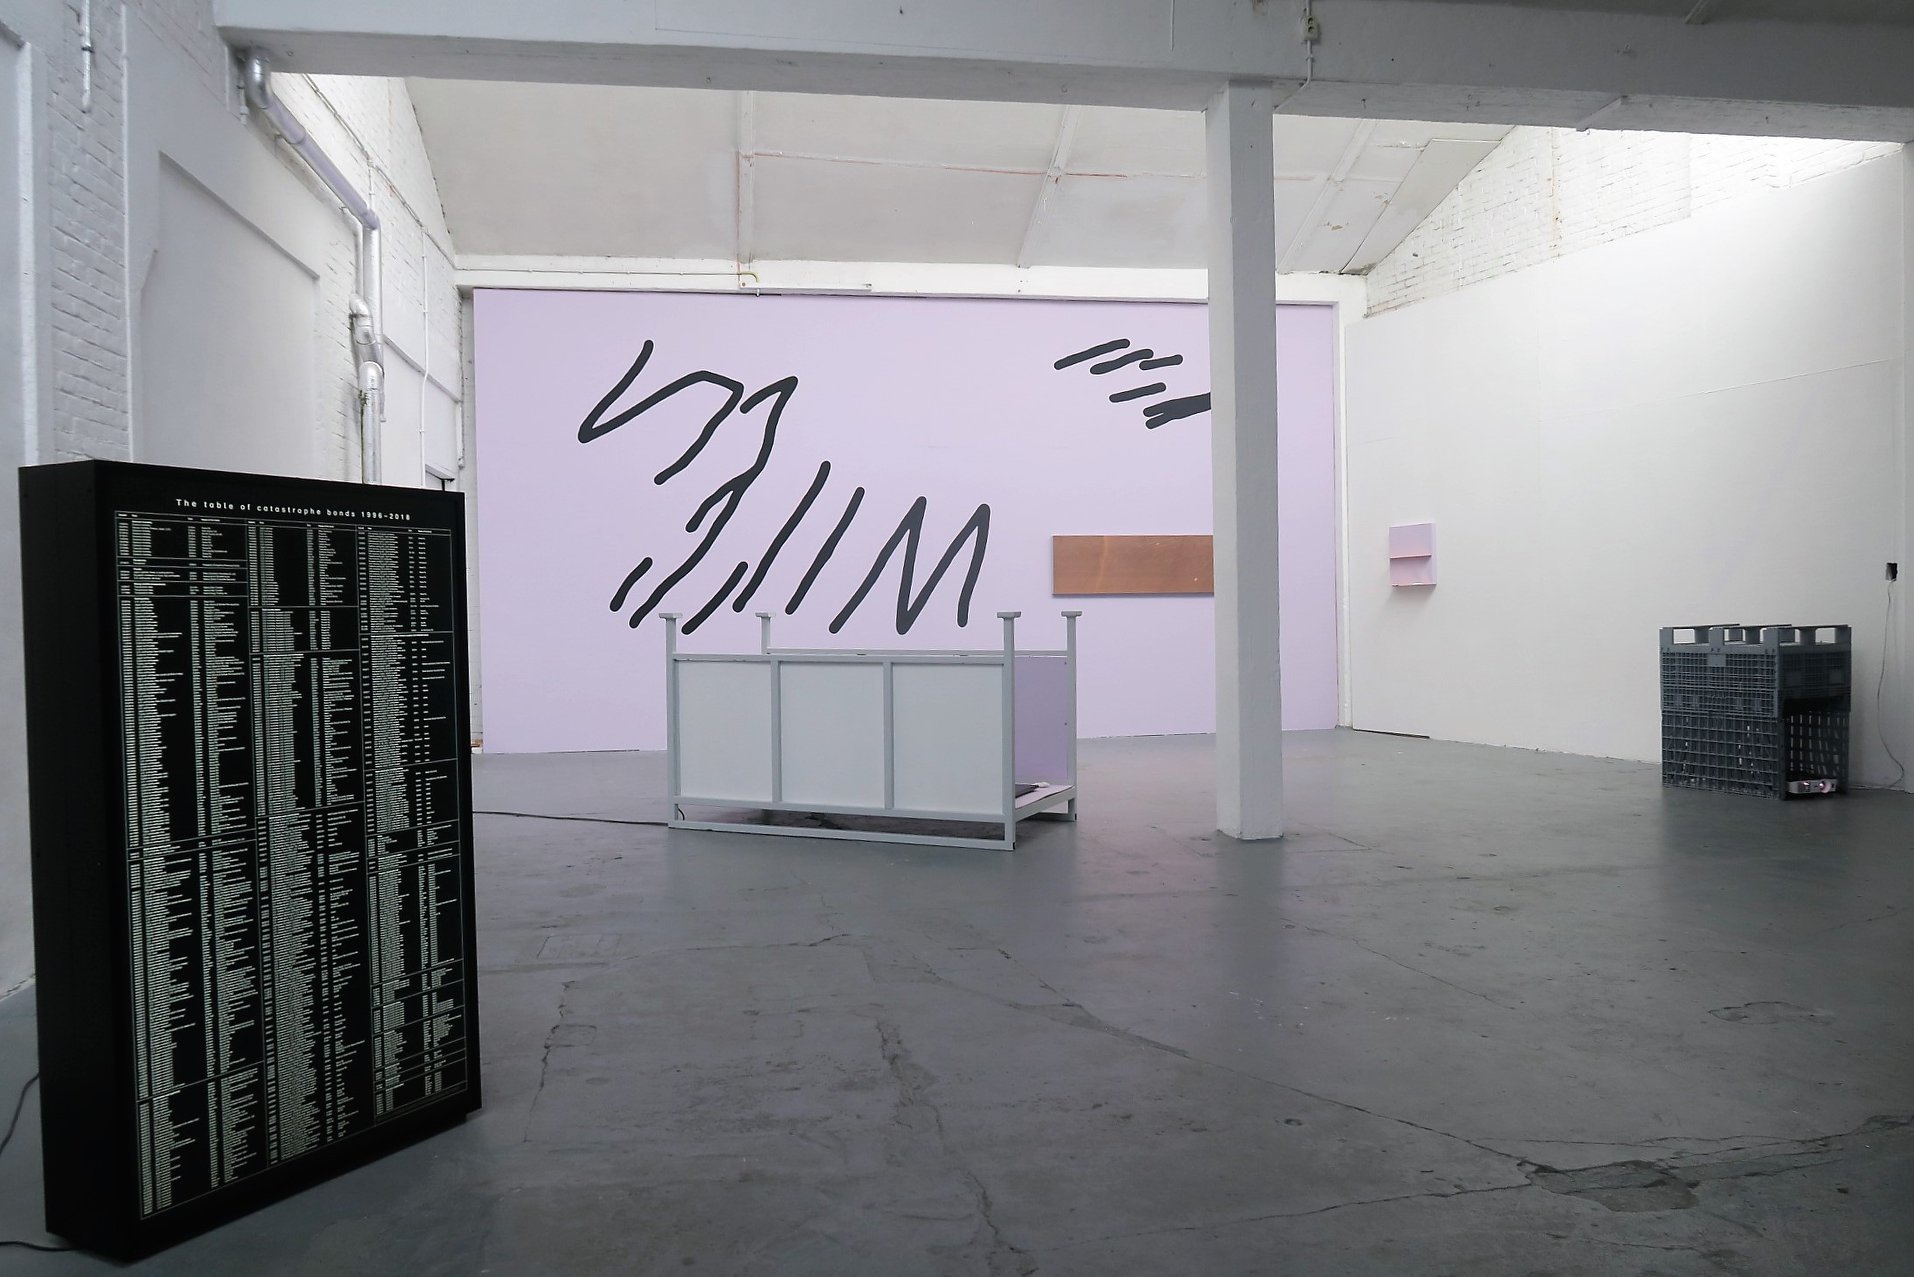
A Doodle, A Diagram, A Disaster
solo exhibition / Expoplu, Nijmegen (NL)
11 October – 24 November 2019
In the solo exhibition ‘A Doodle, A Diagram, A Disaster’ Femke Herregraven presents her artistic research on how nature as an object is marked, abstracted and quantified. Her research into value markings, scratches, satellite imagery, and financial derivatives form the starting point for new imaginative stories and objects.
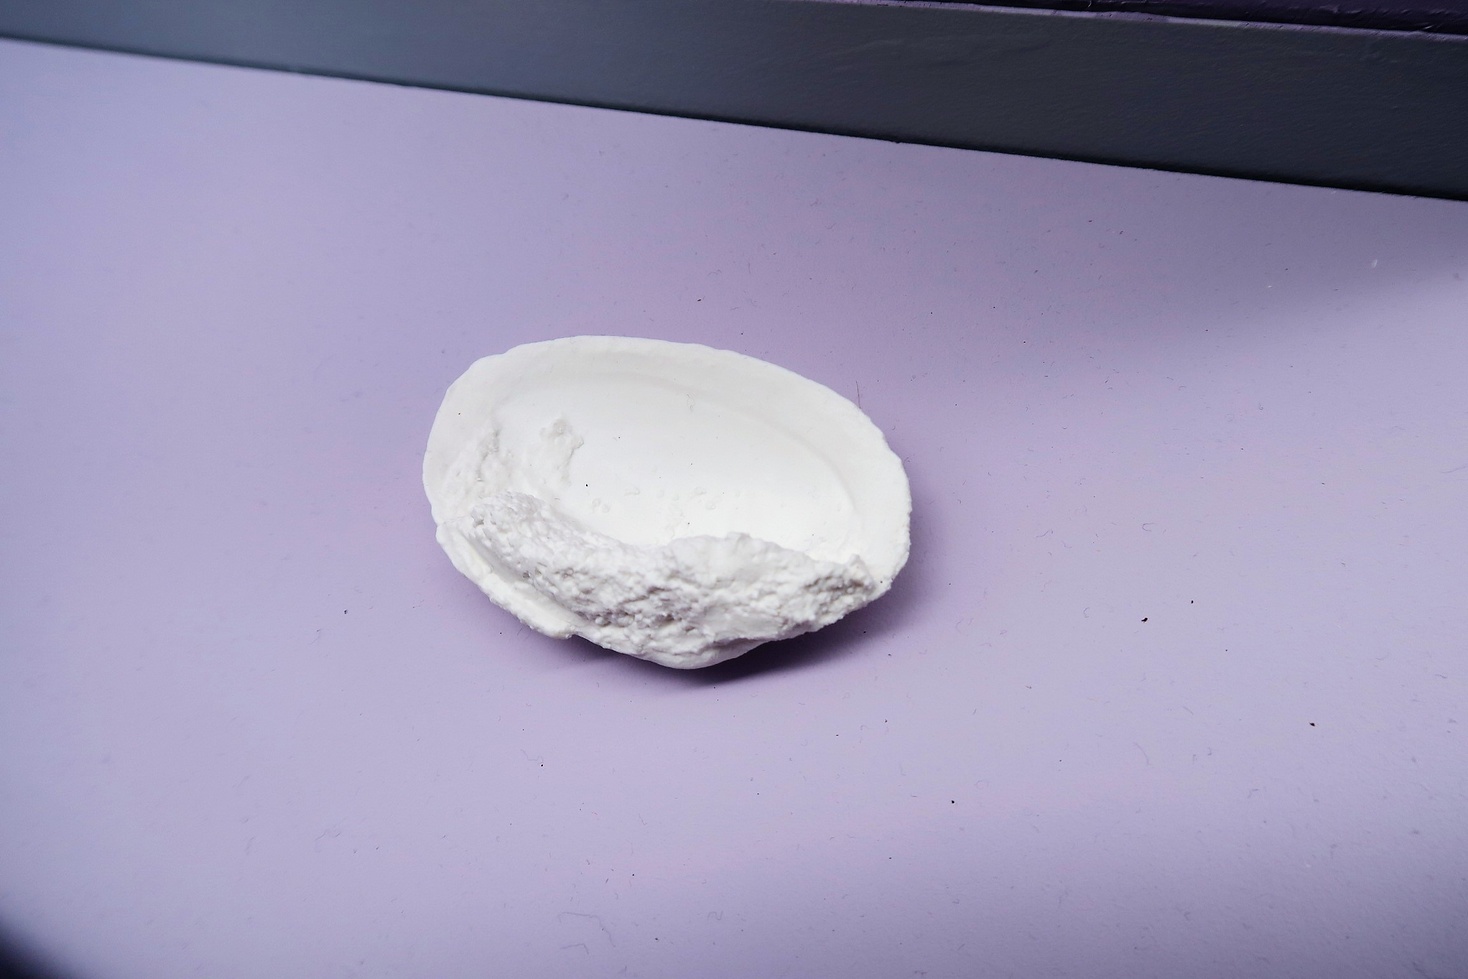
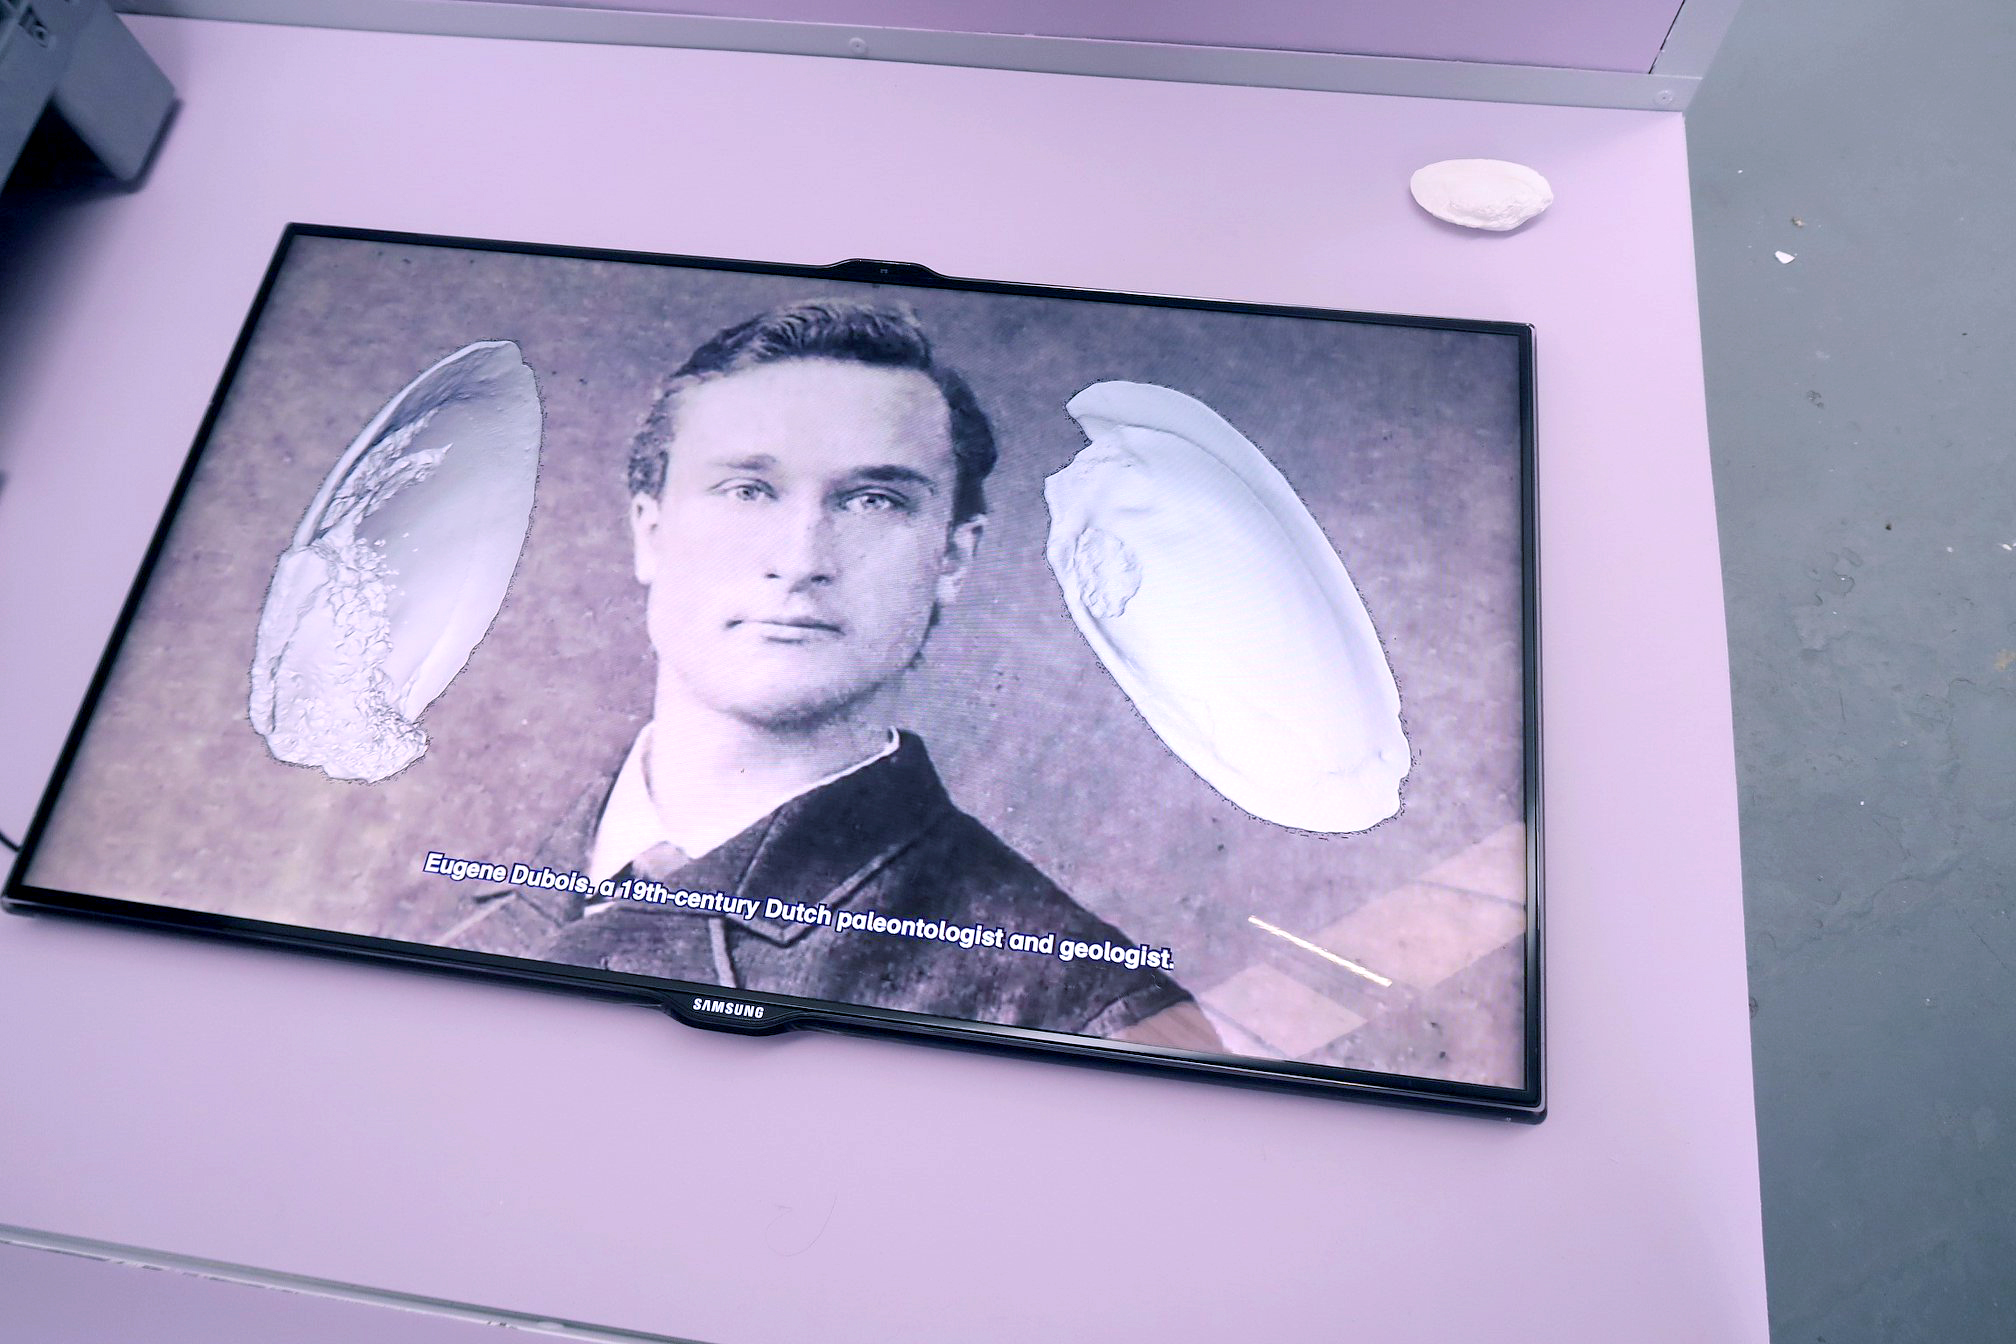
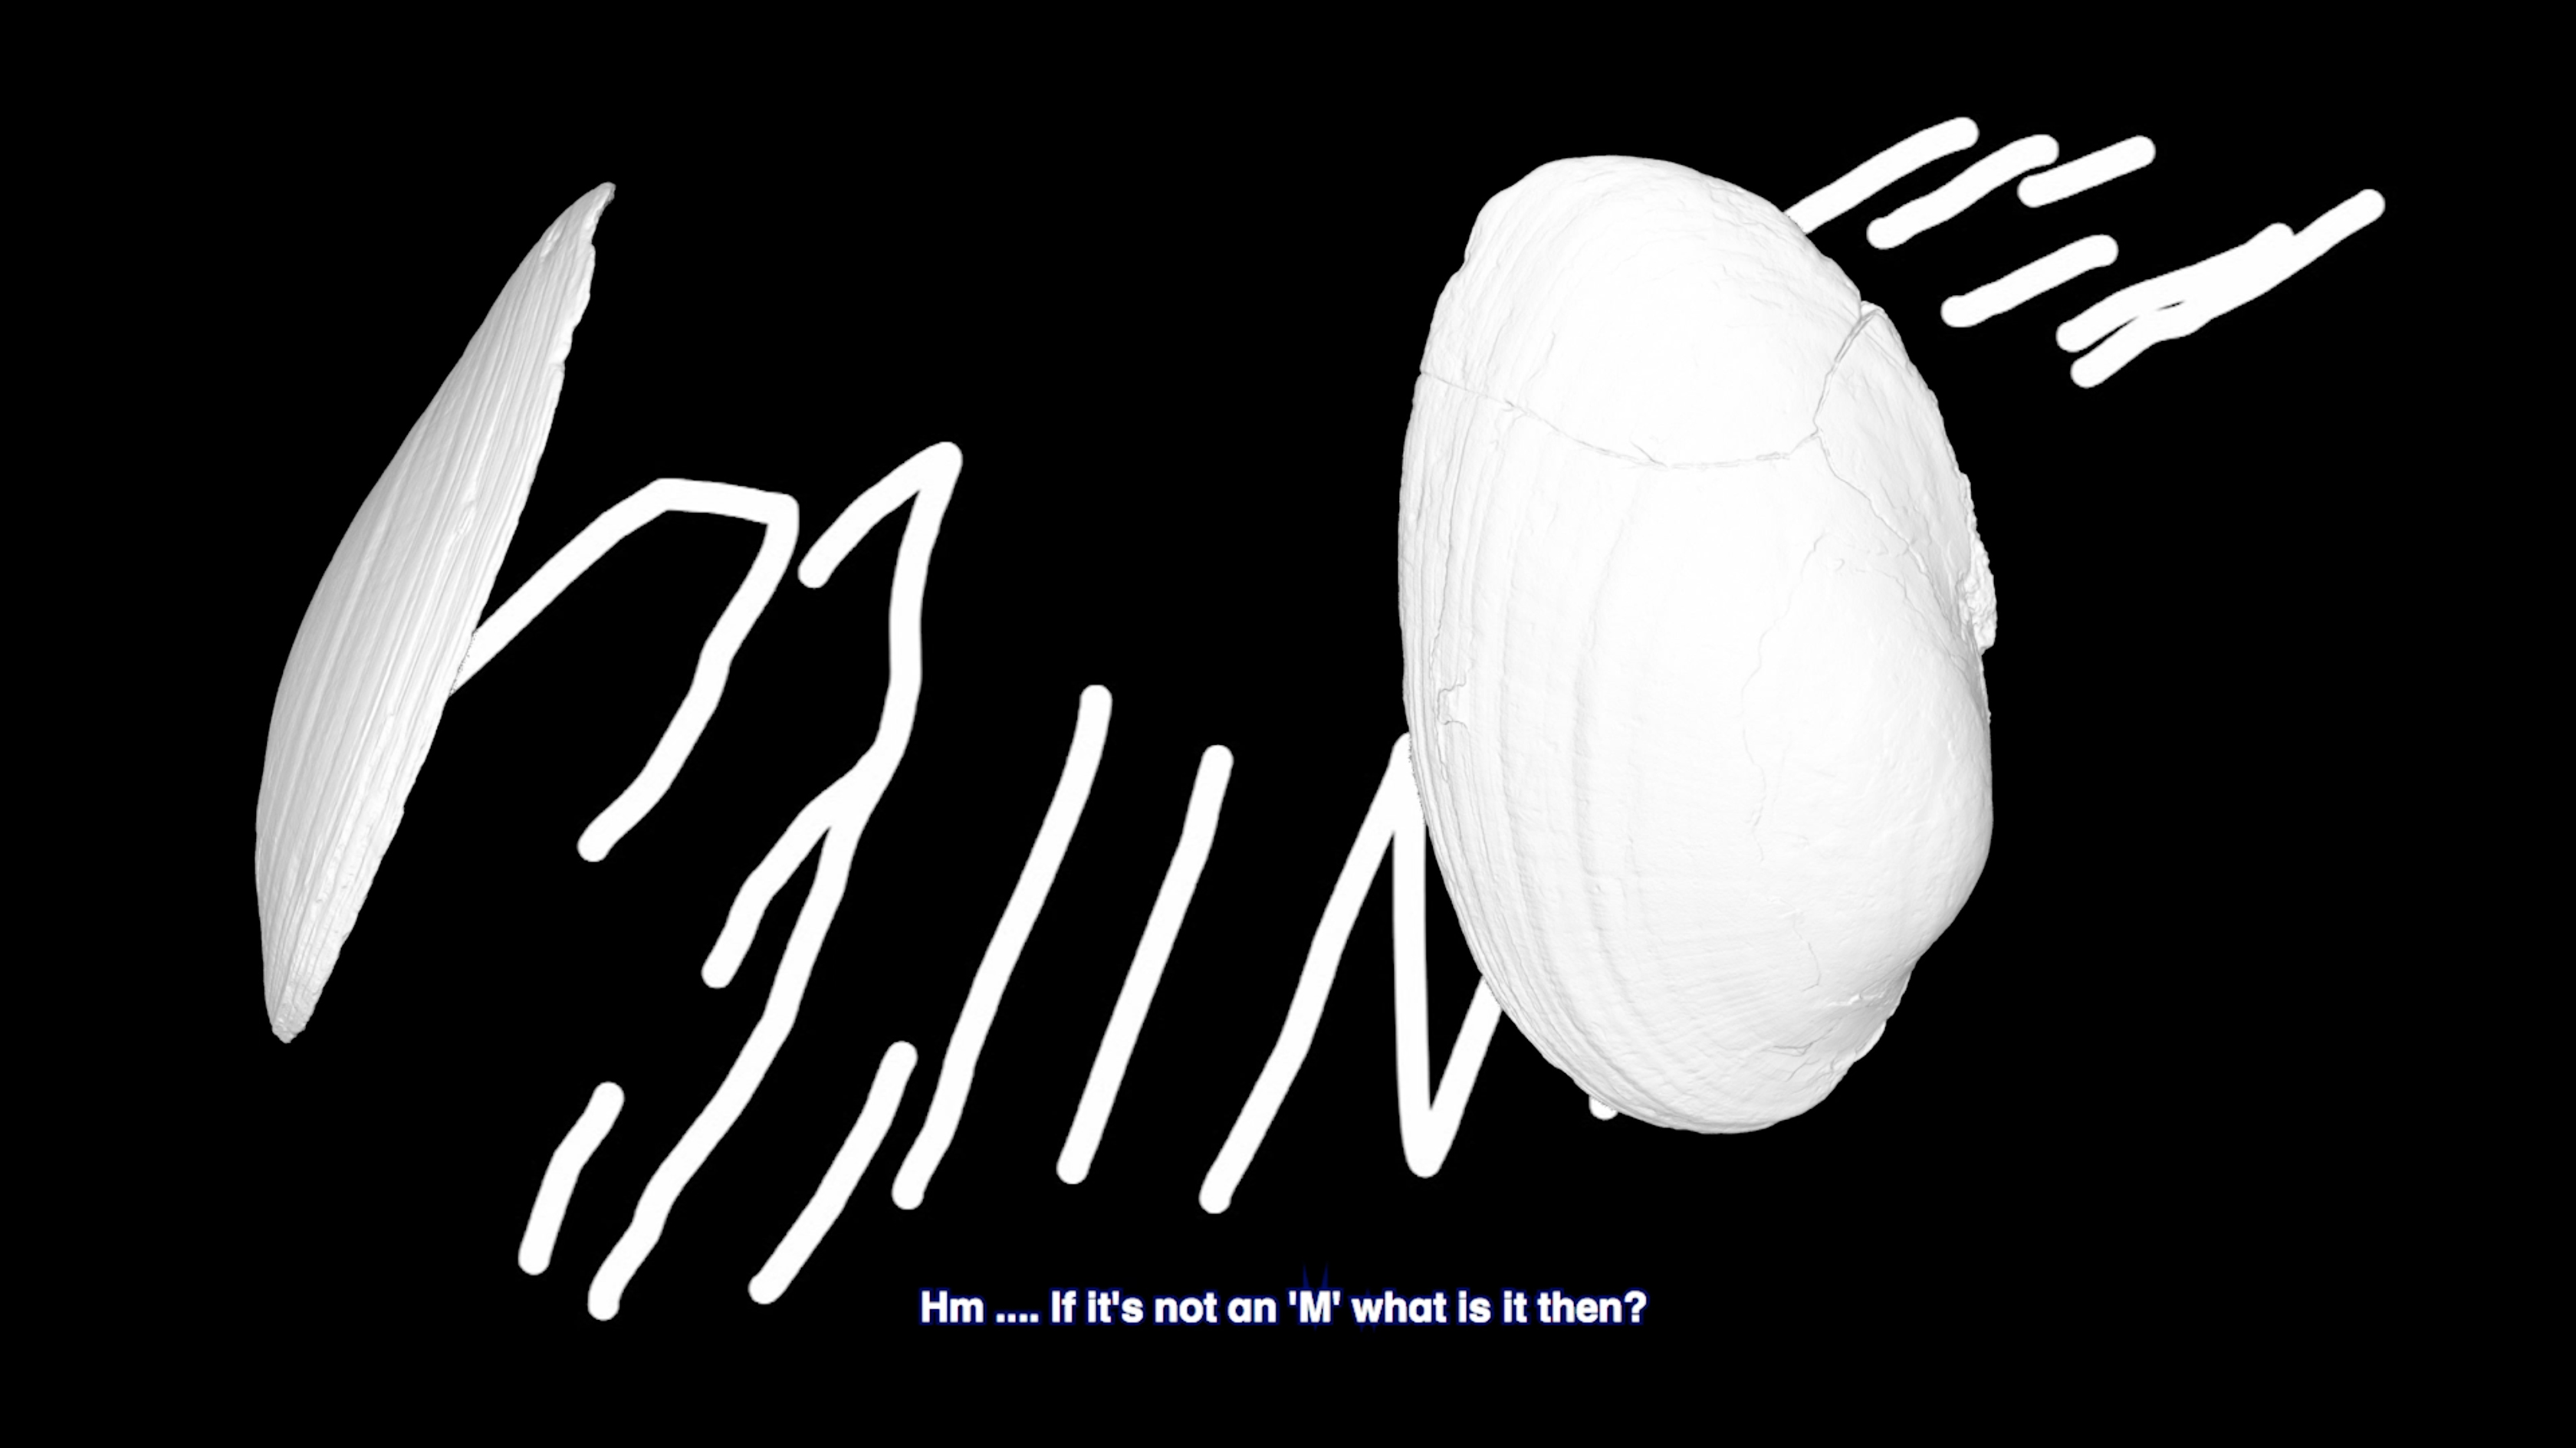
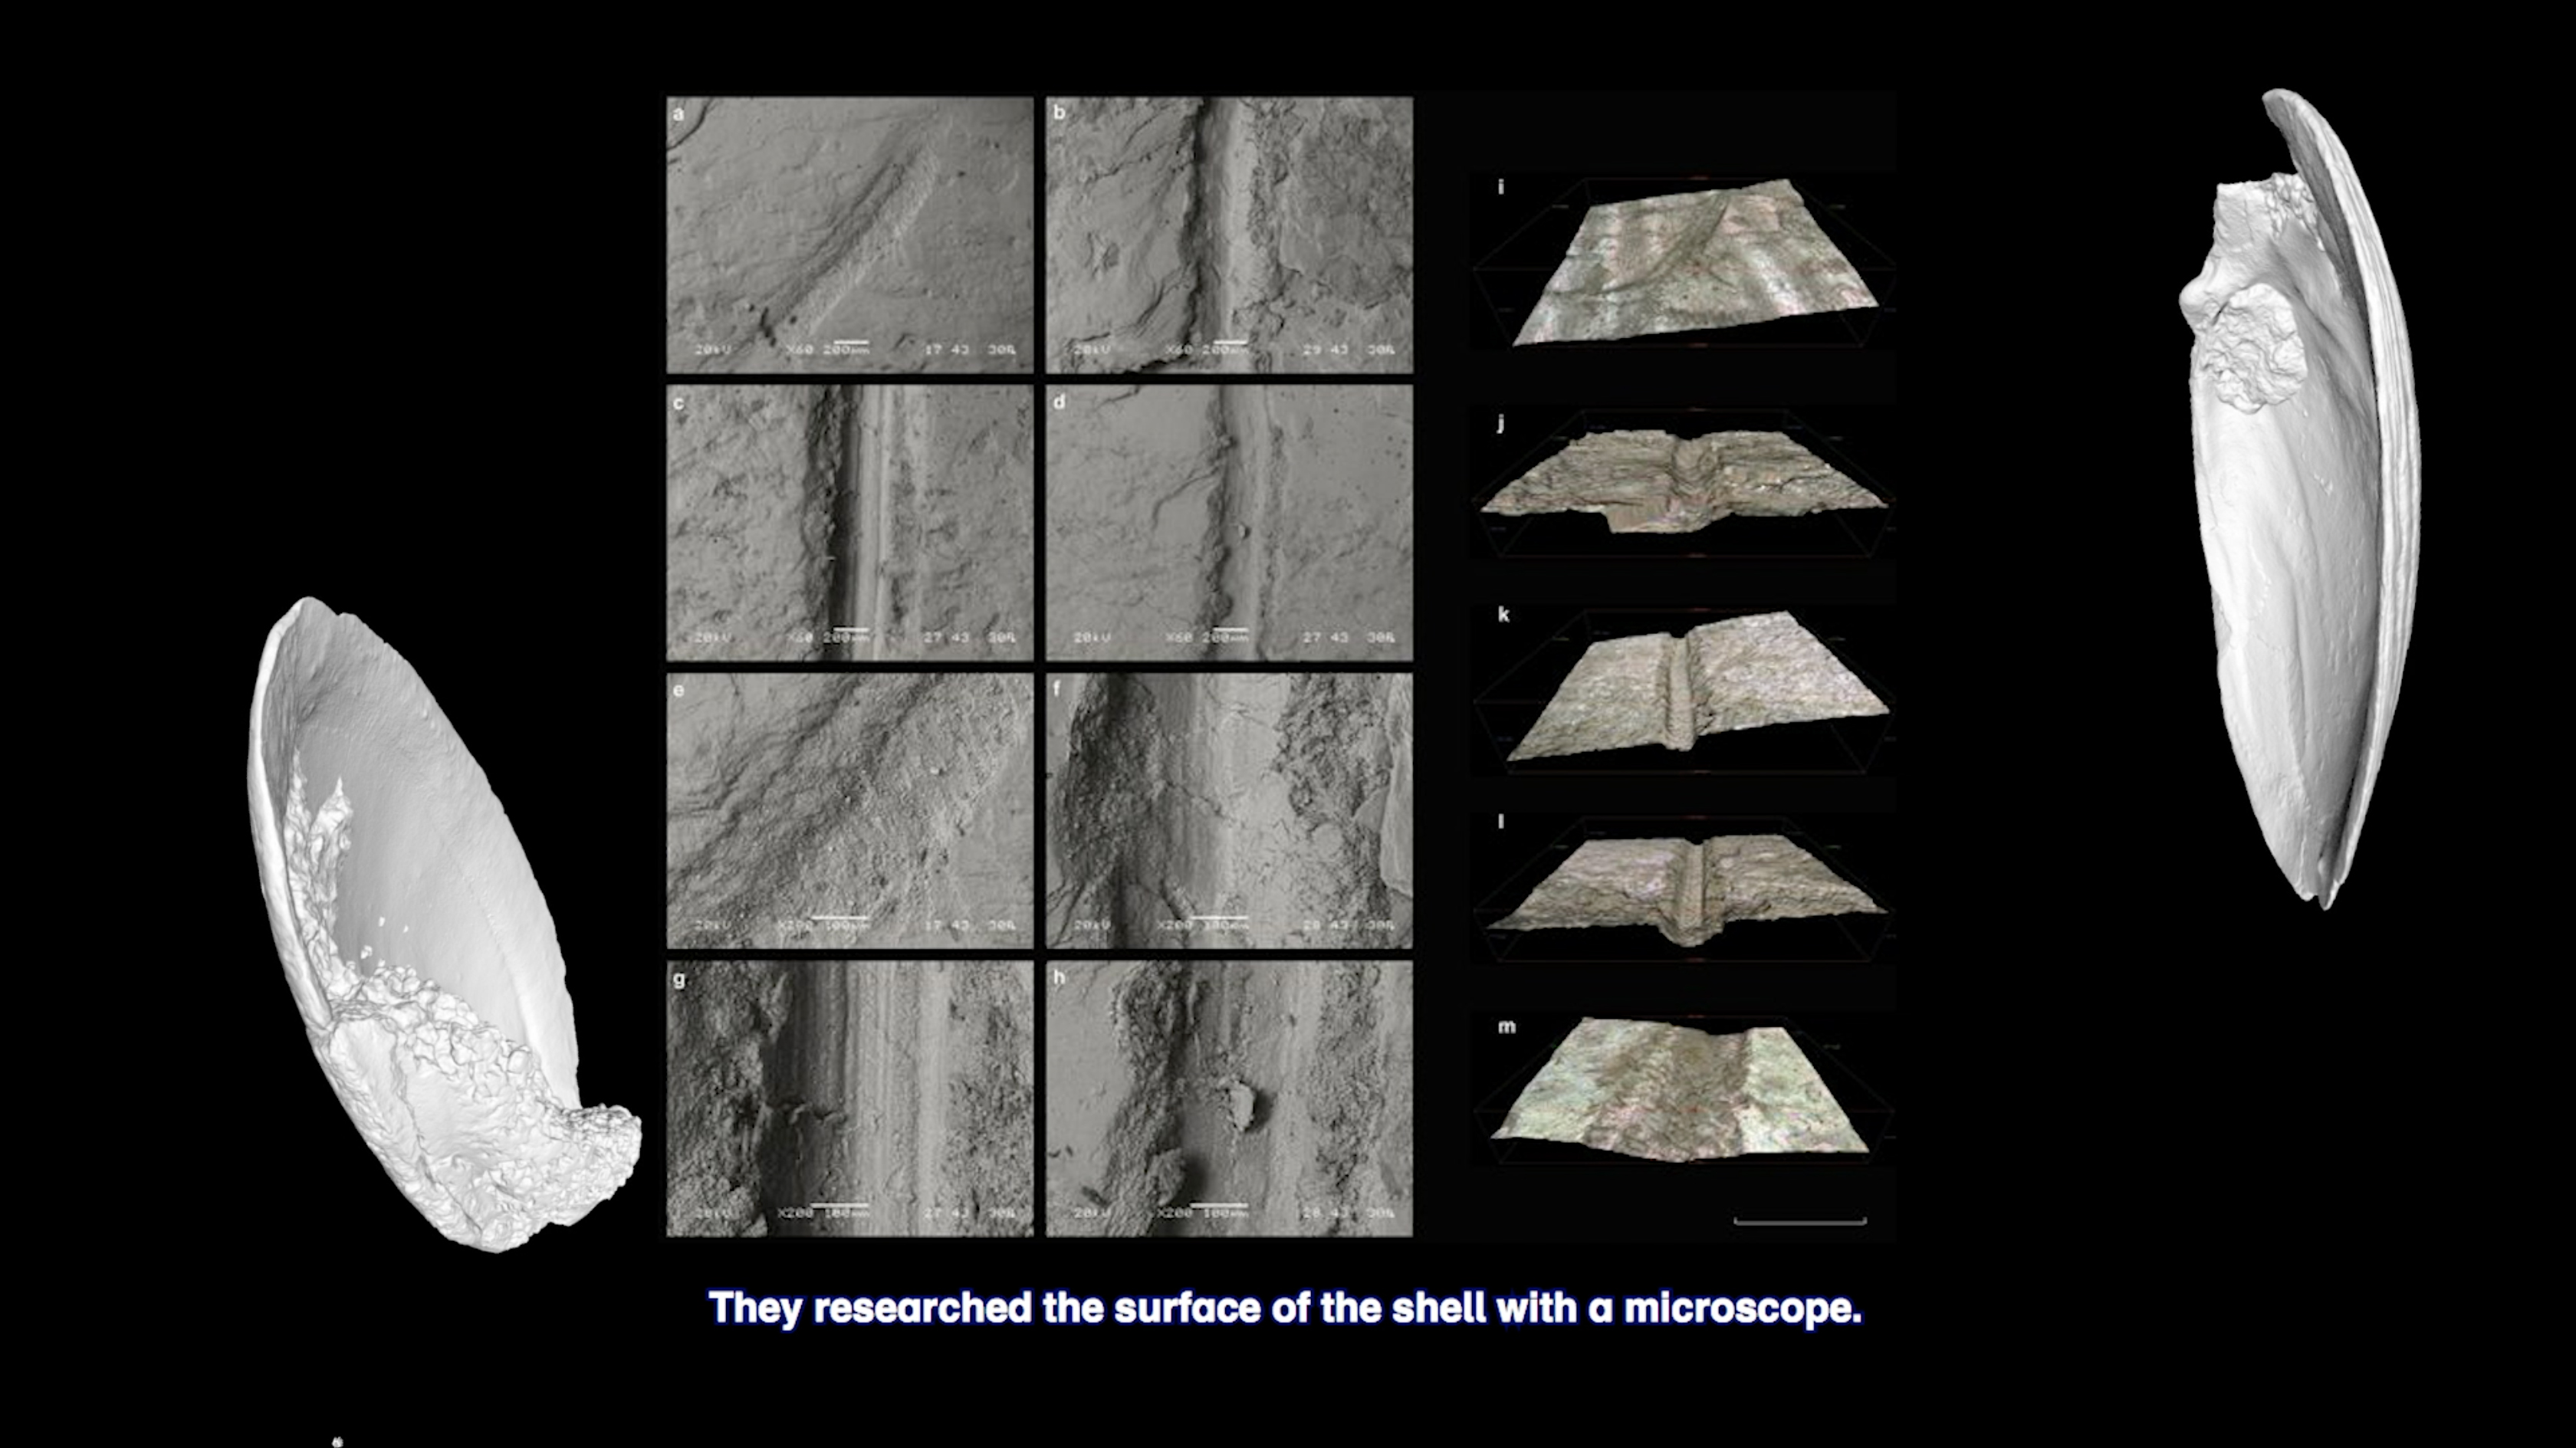
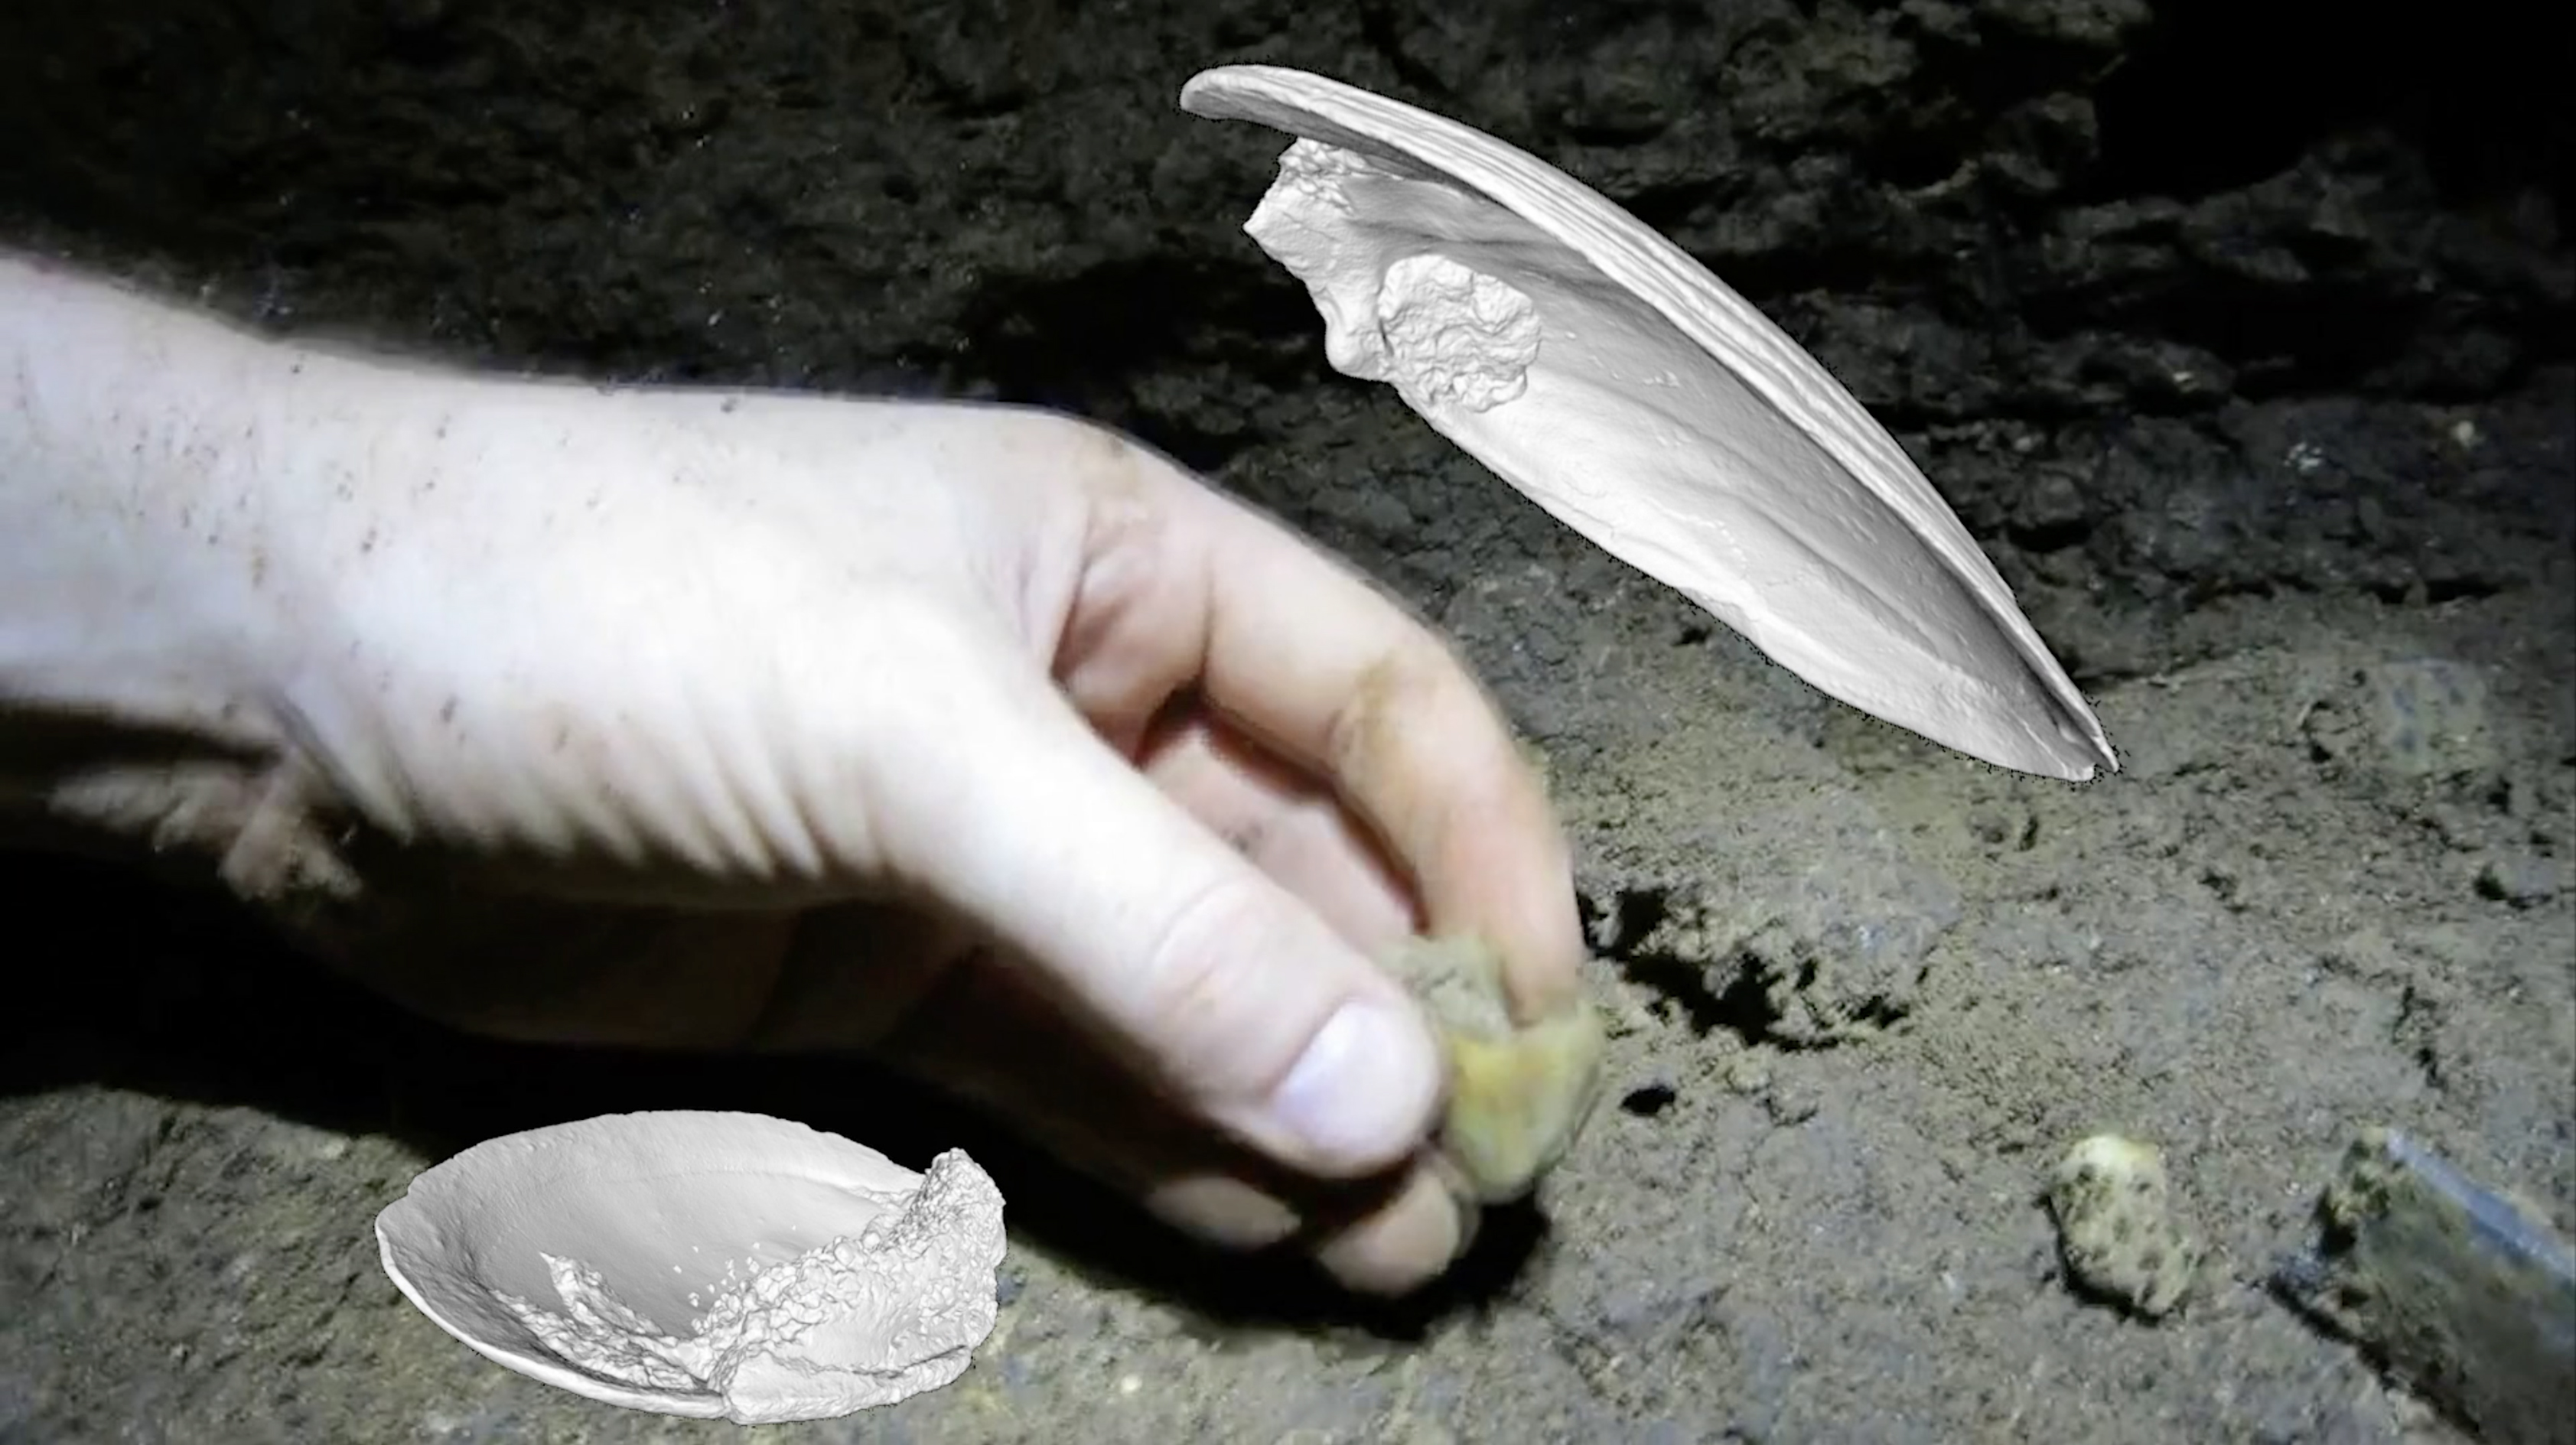
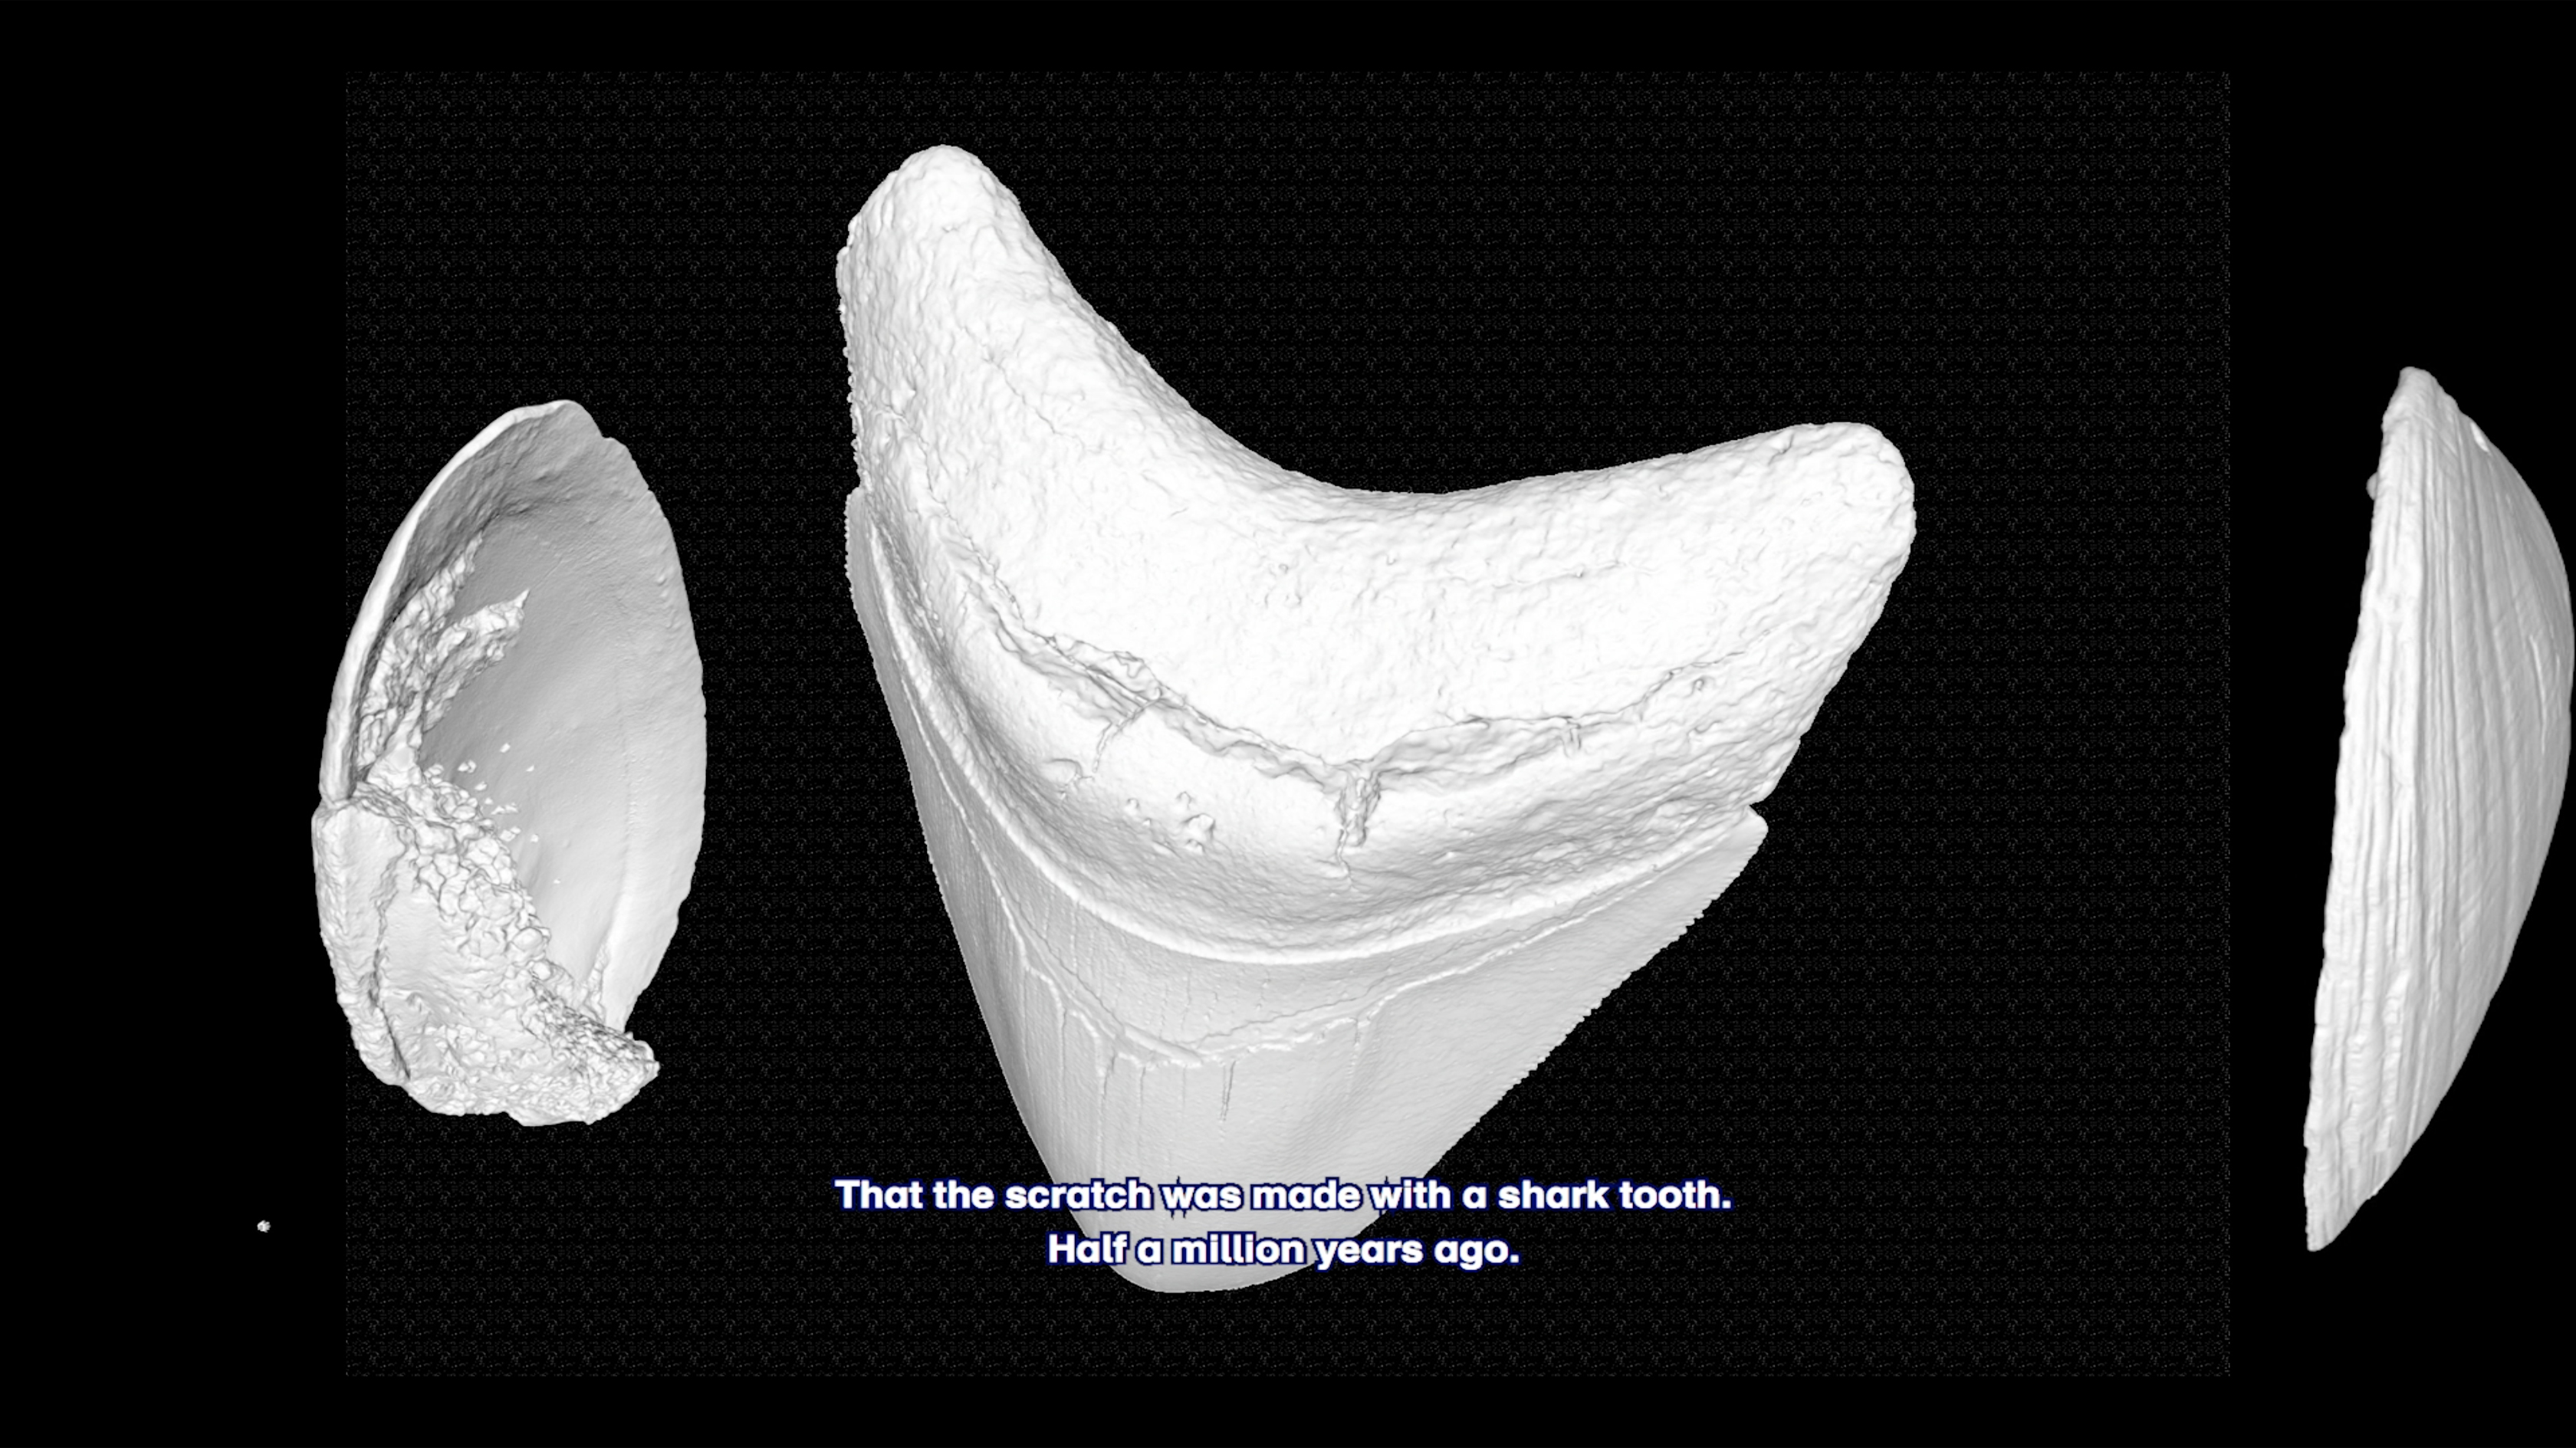
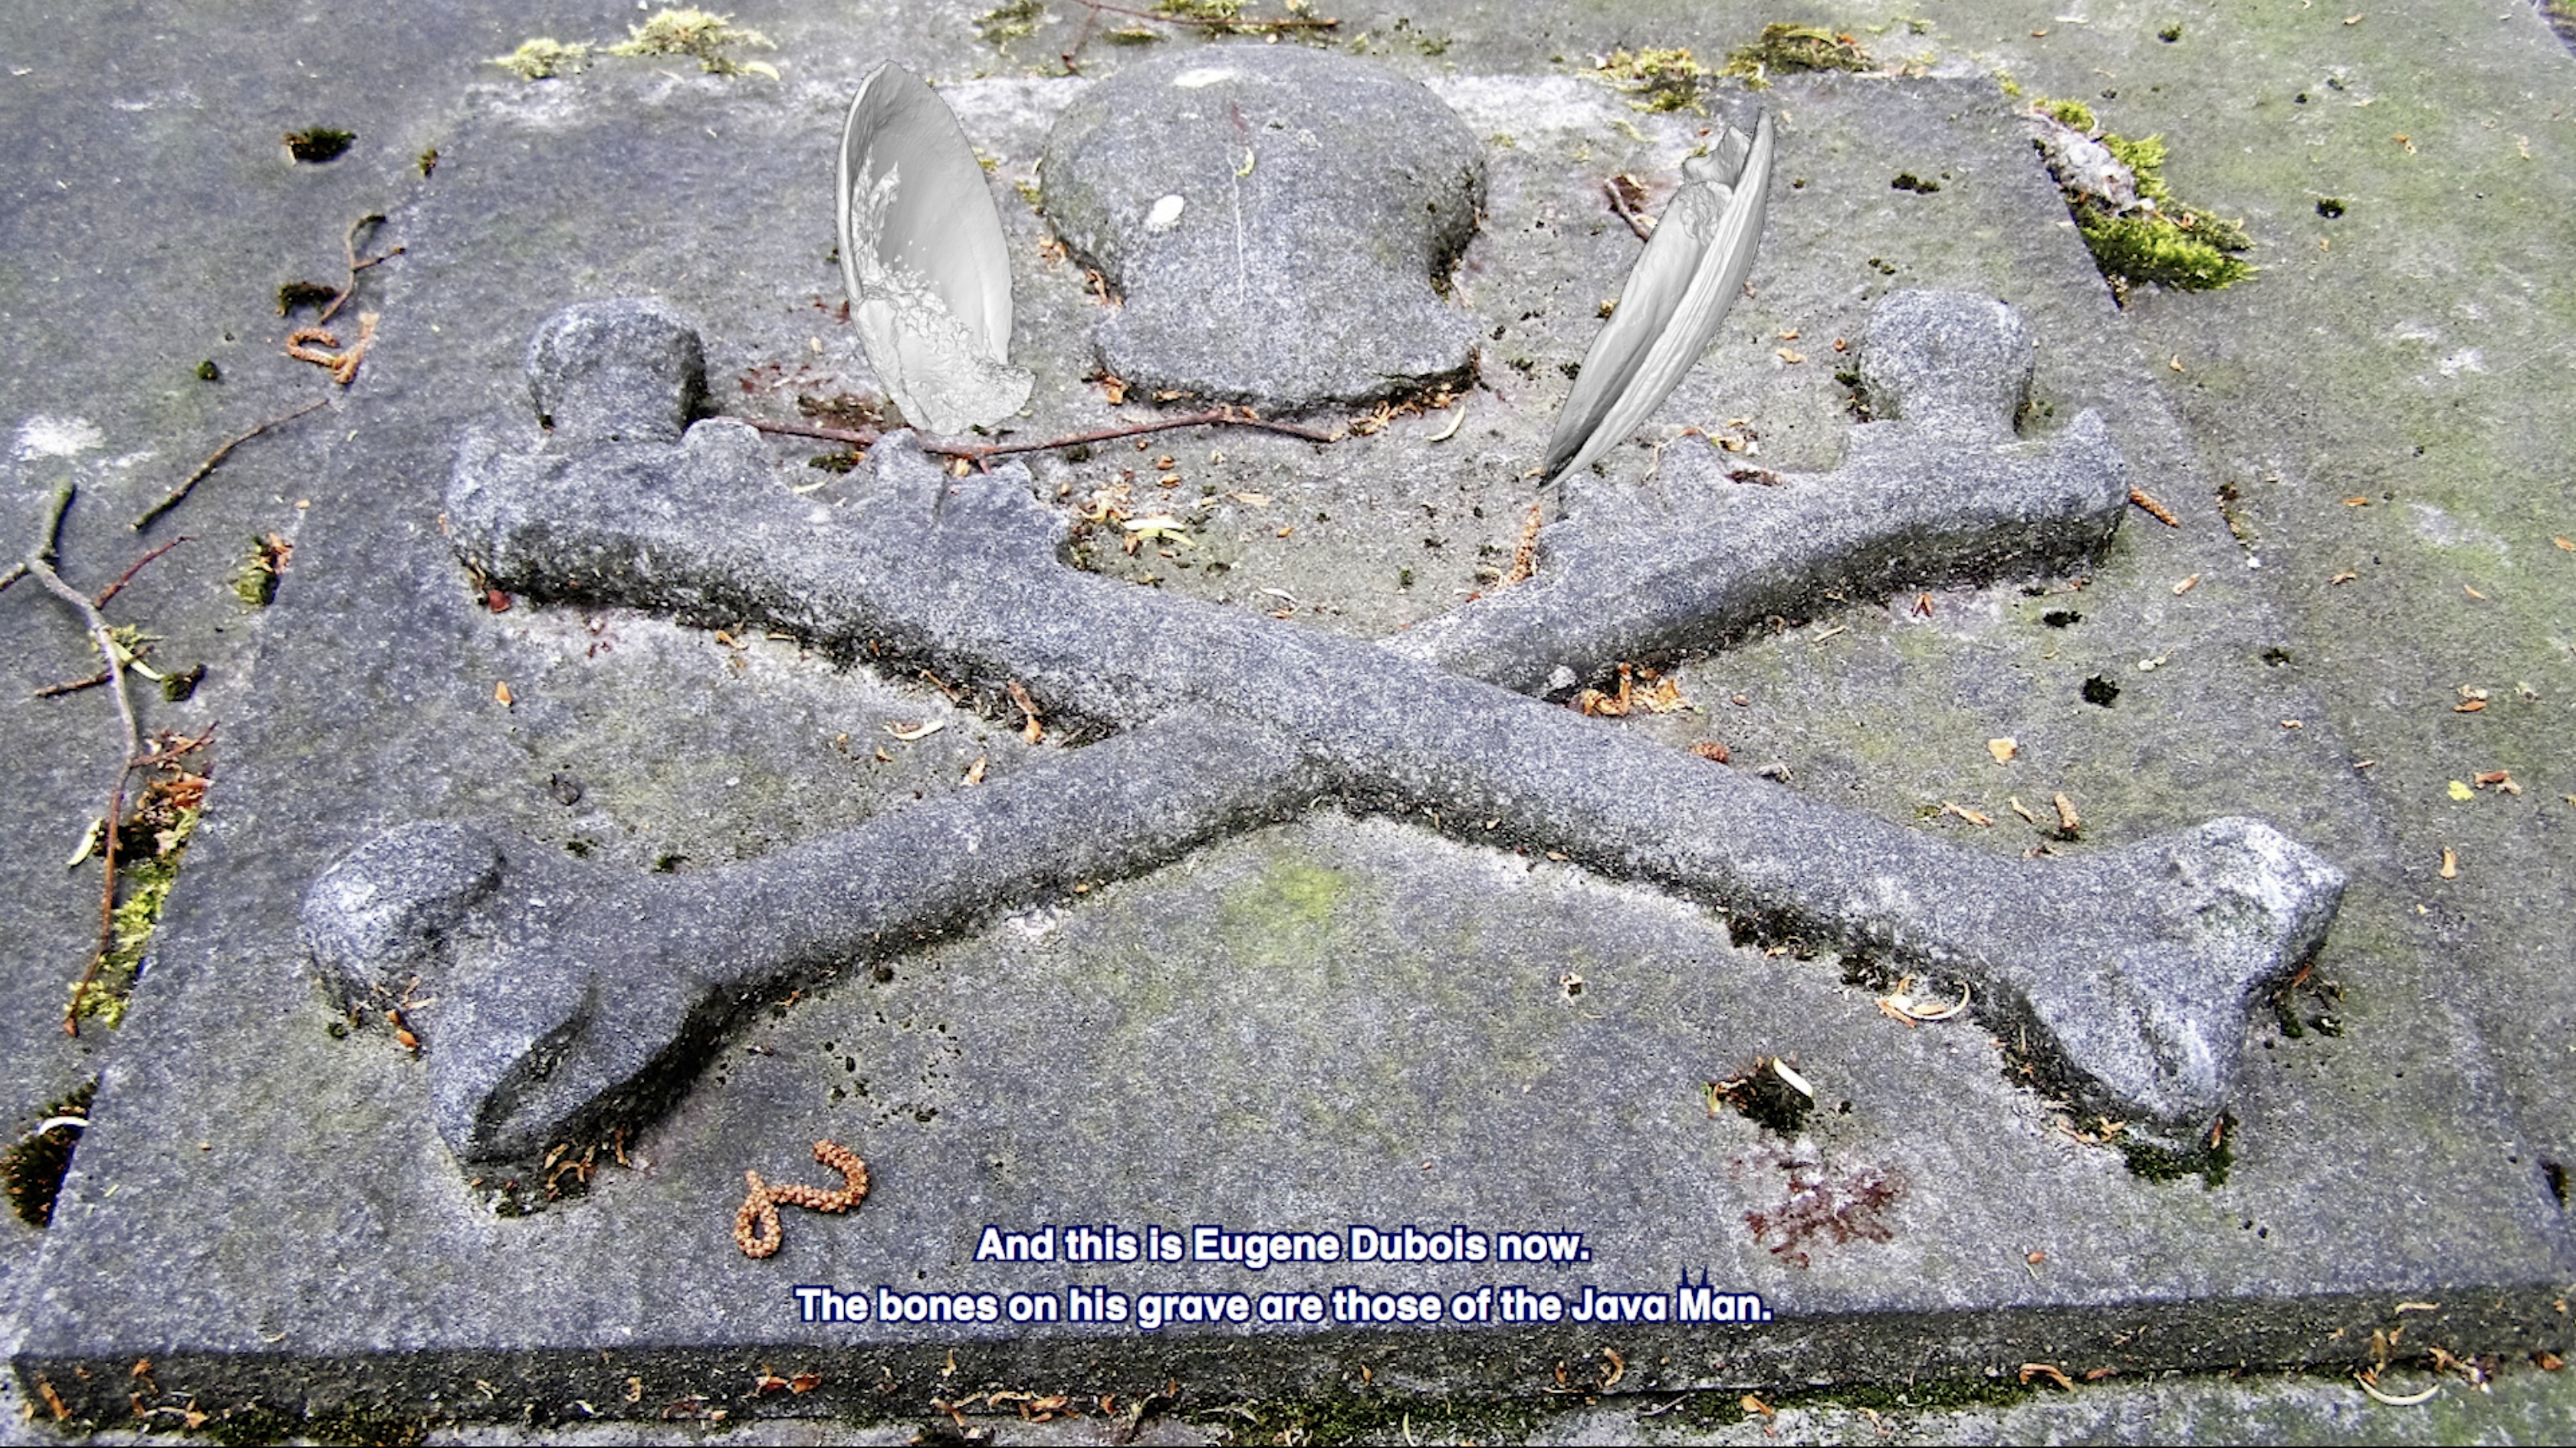
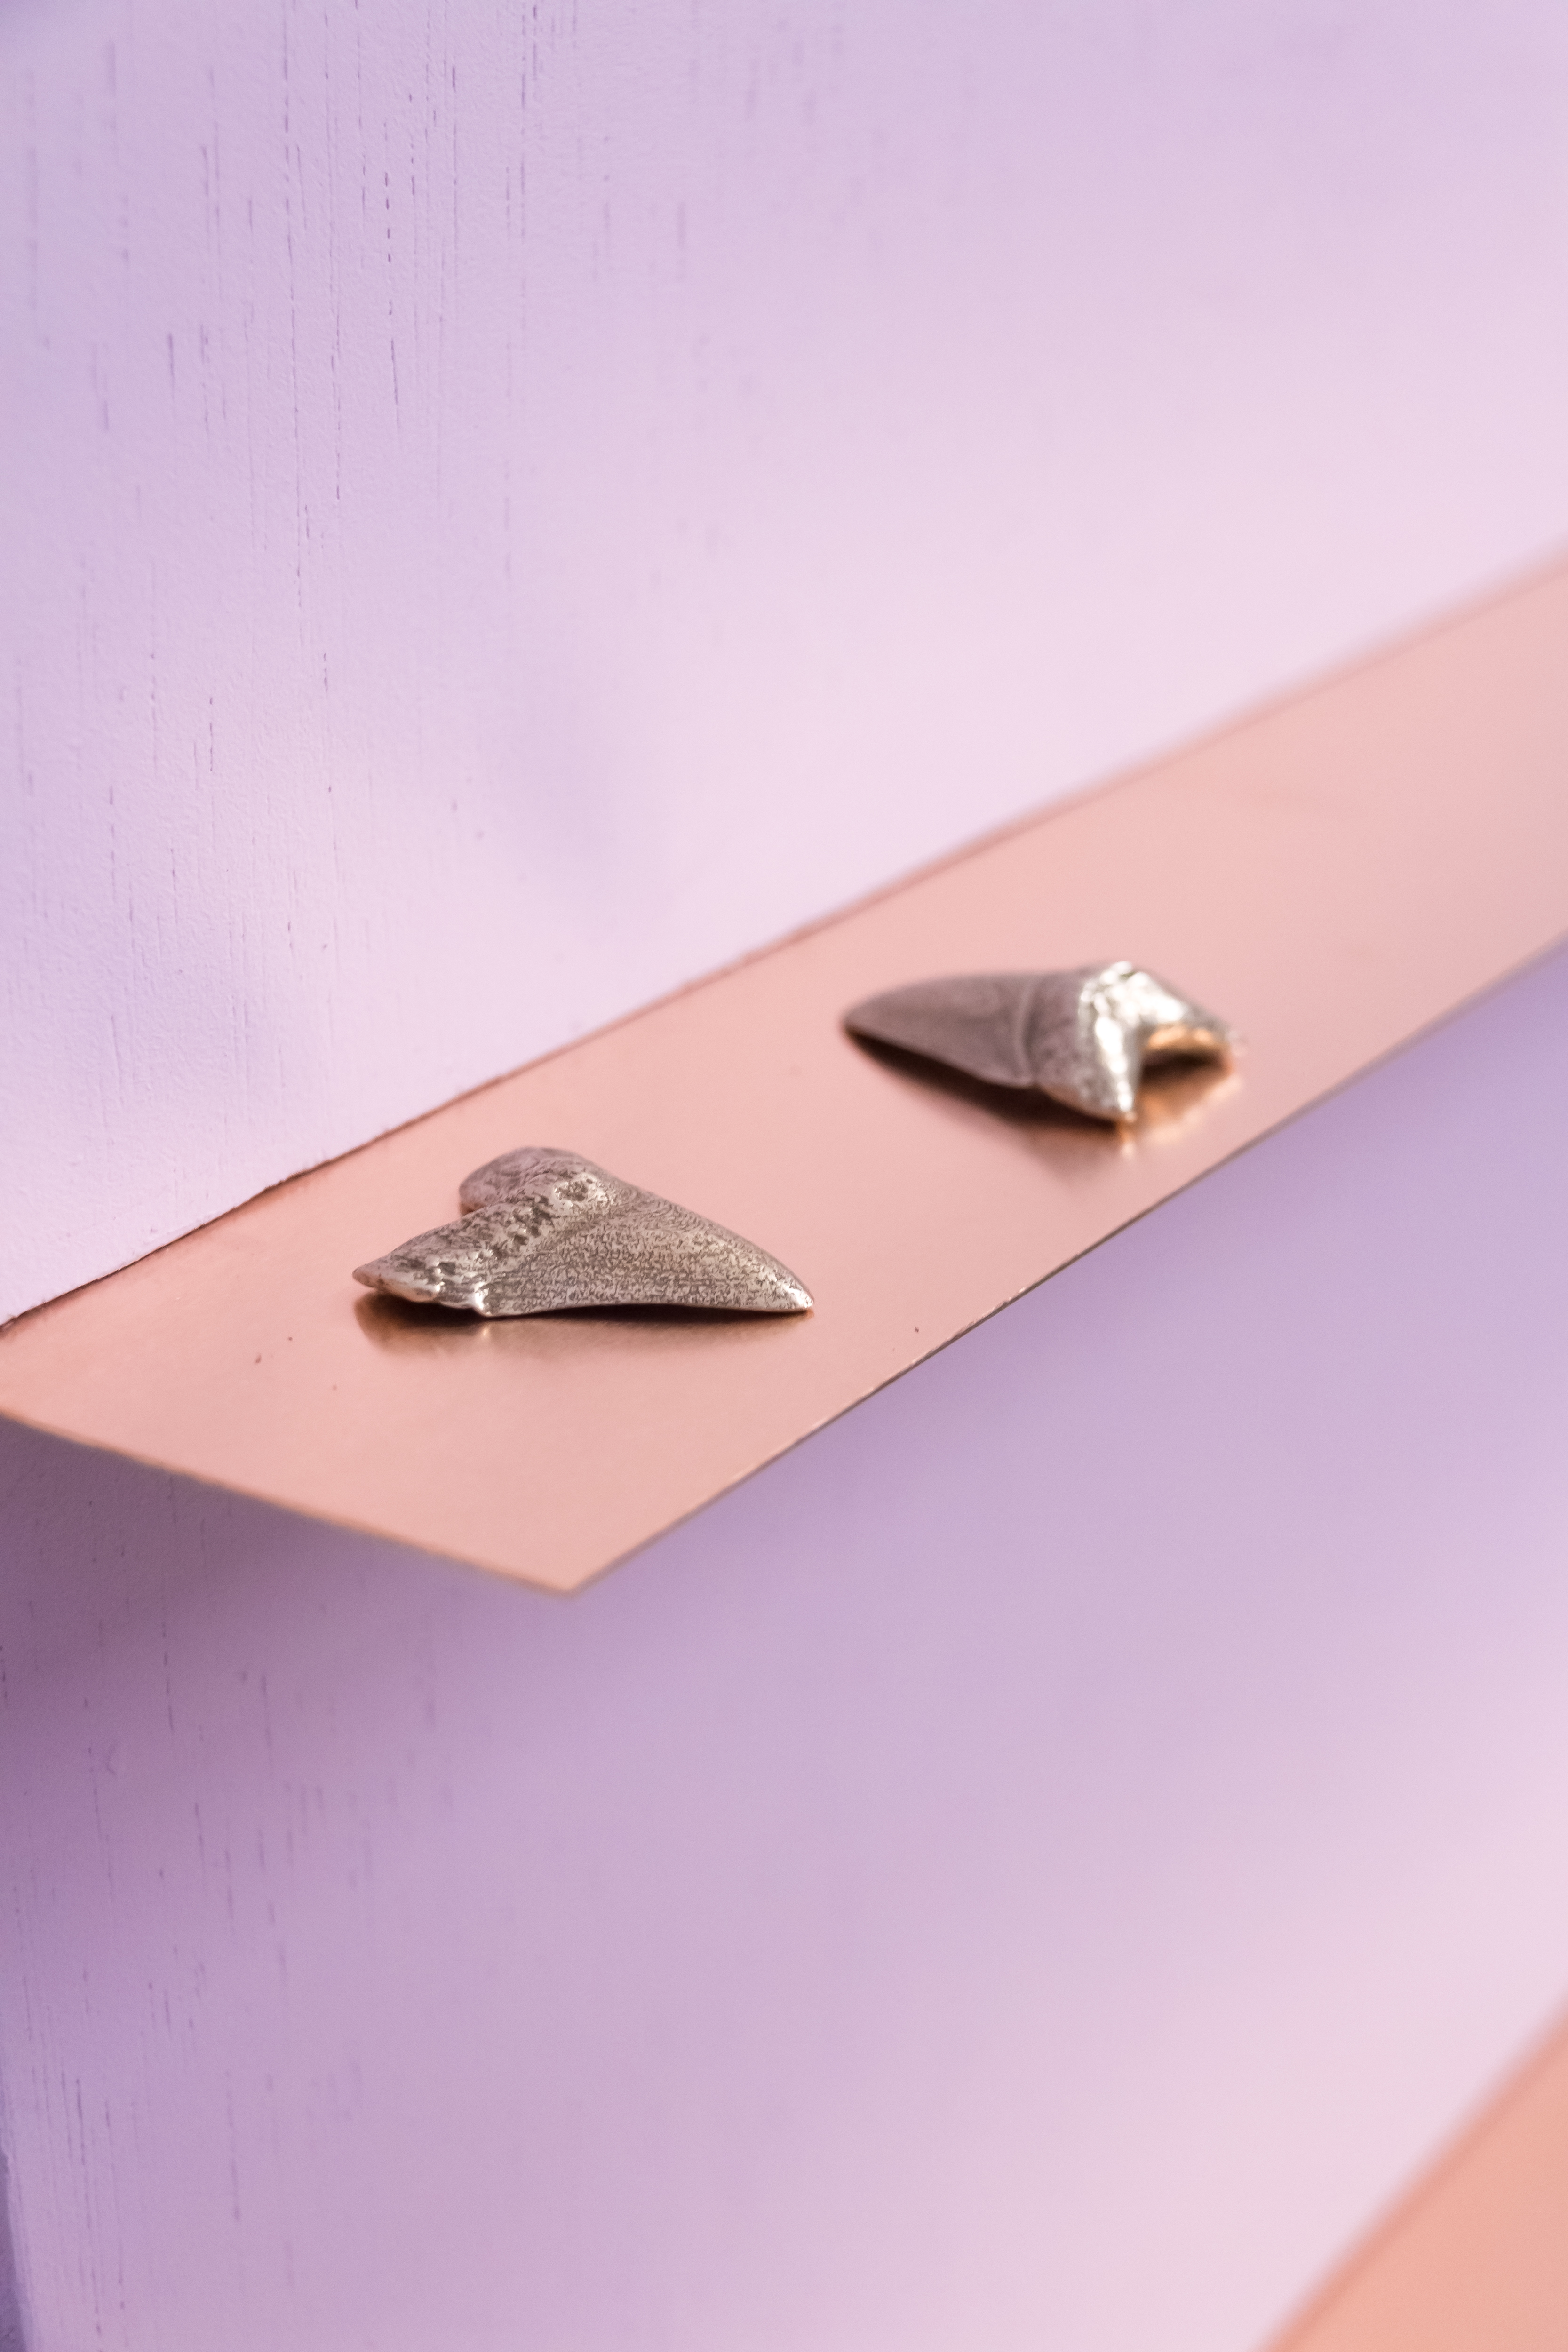
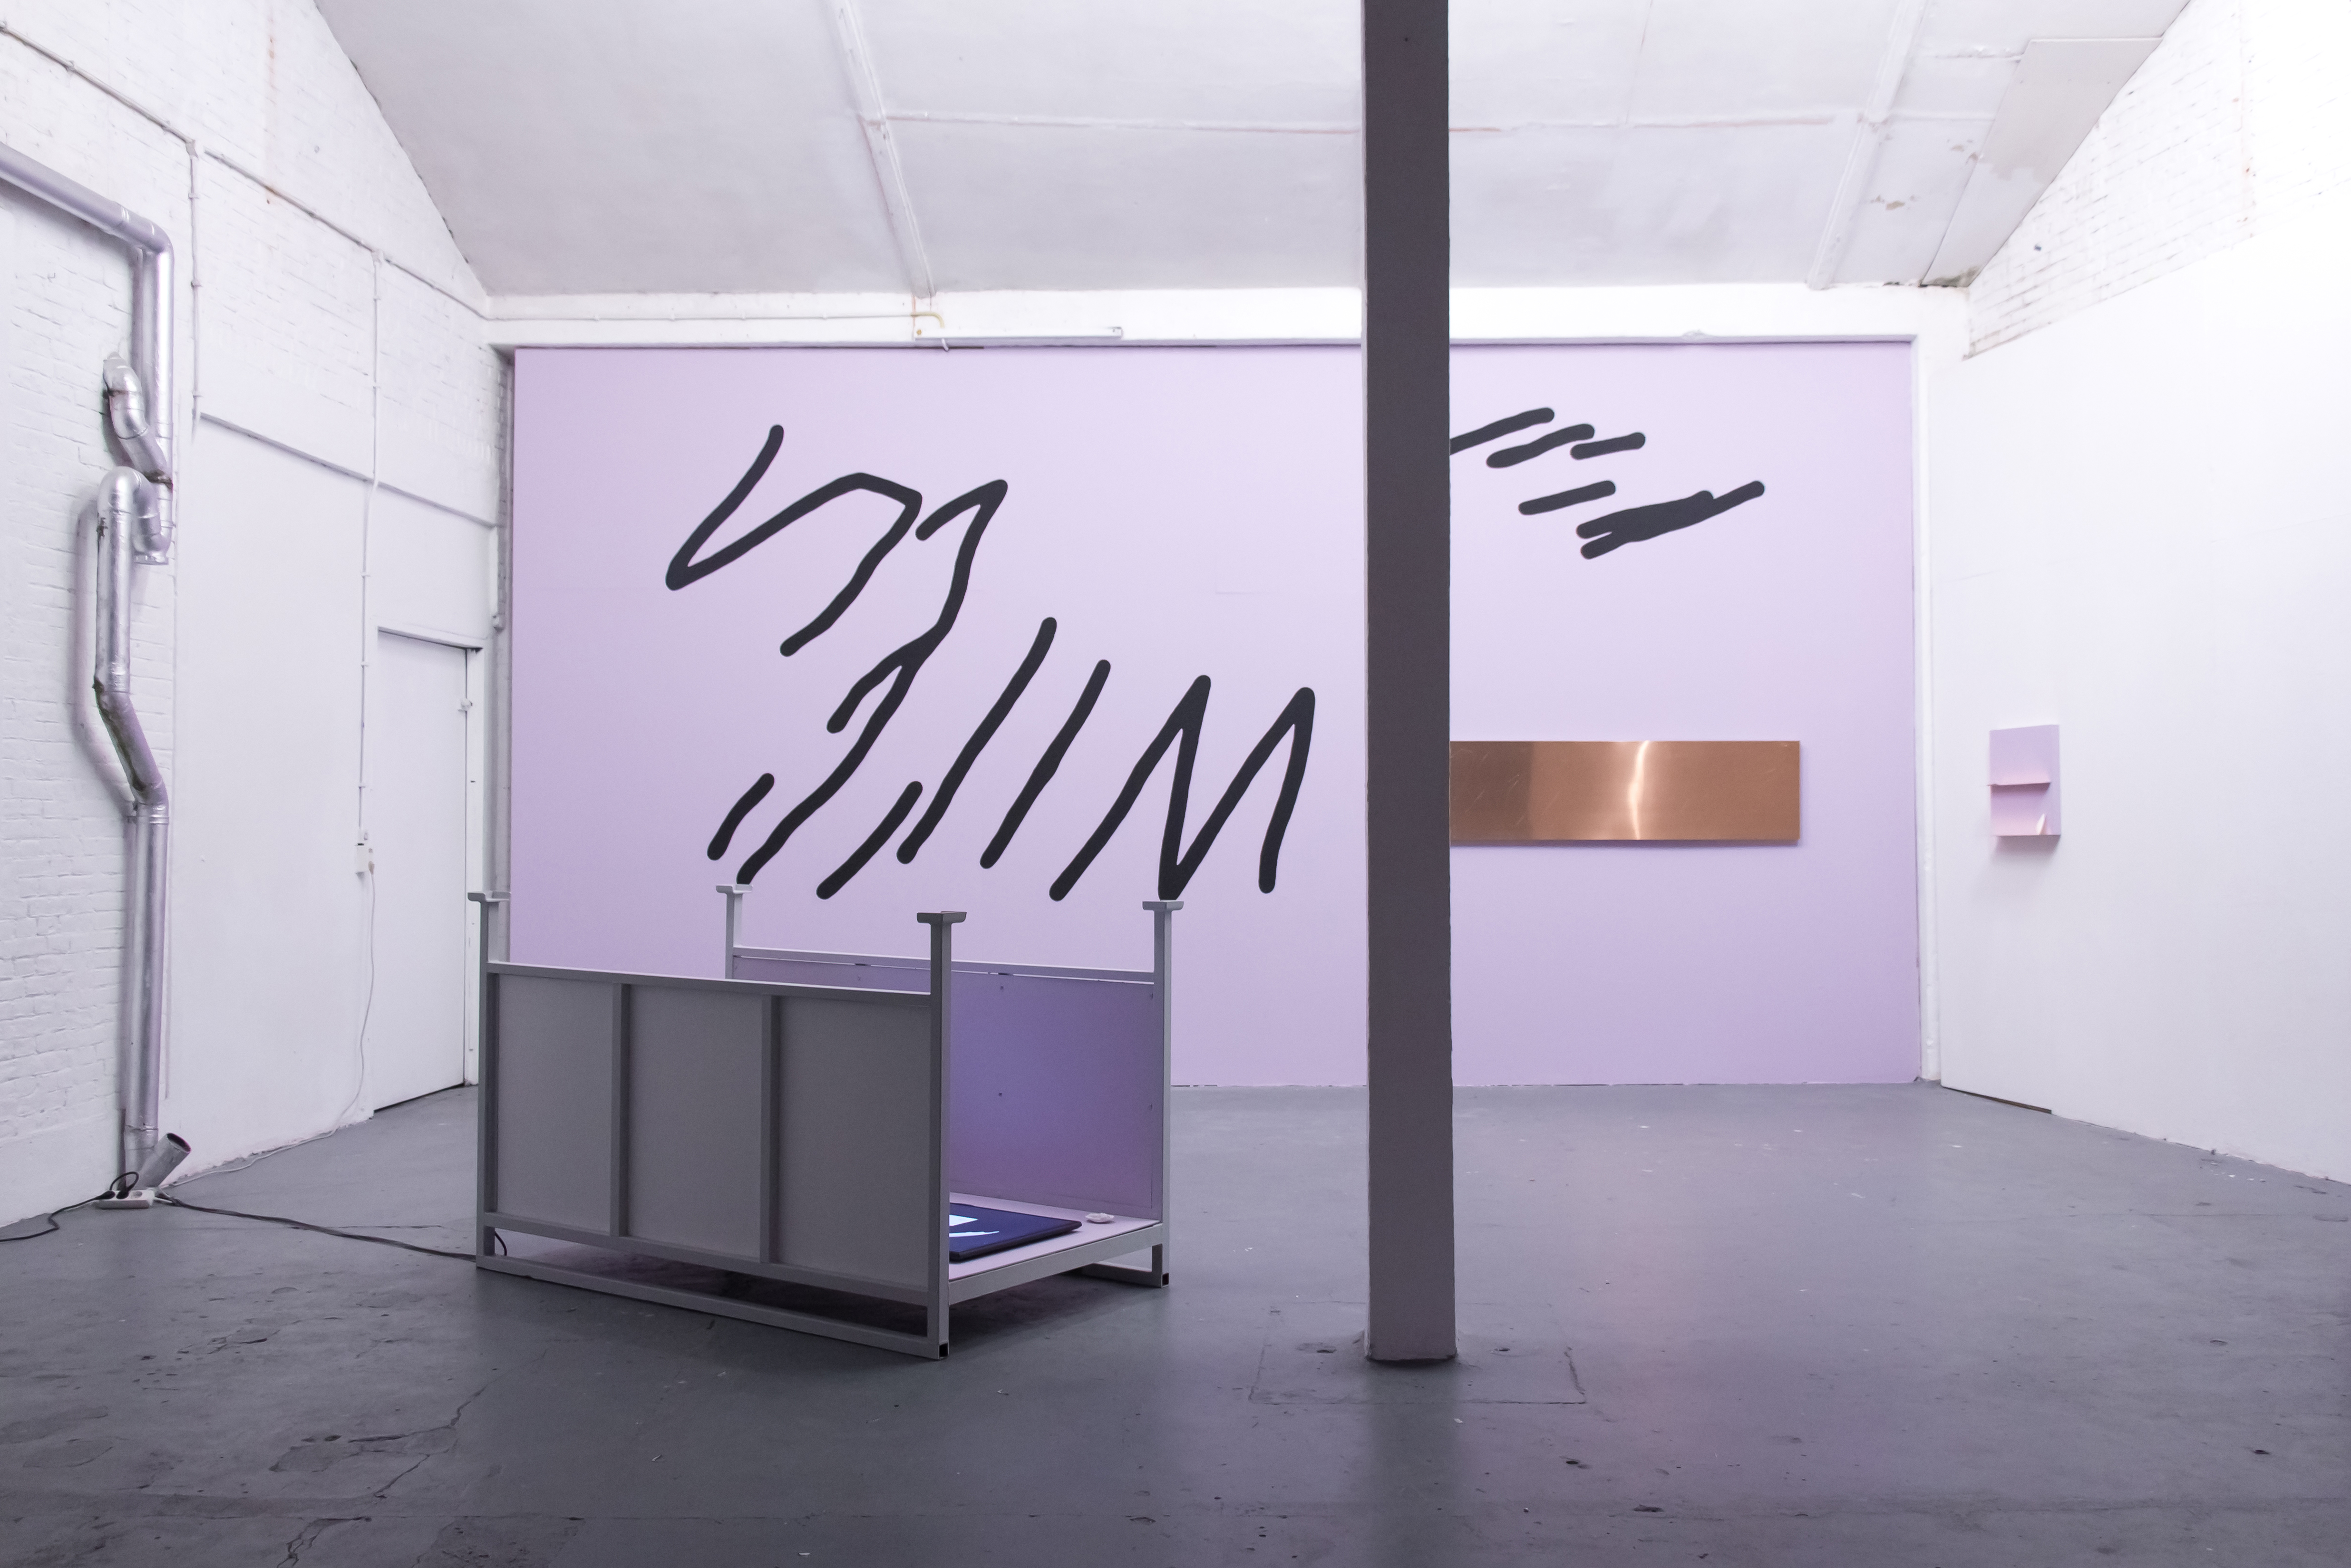
In the exhibition Herregraven speculates on a zig zag scratch in an ancient shell of half a million years old. Only recently it was discovered that shell DUB1006-fl, taken from Java by Dutch palaeontologist Eugène Dubois, carries geometric scratches of at least 500.000 years old. As the scratches had been continuously applied by using a shark tooth as tool, it was concluded that the author had been an early ancestor, Homo Erectus. This doodle might be one of the very first drawings made by man. Even though the meaning of the scratches are and will remain unknown, they show the ability to abstraction. And how a natural object, a shell, is transformed to a cultural artefact carrying information.
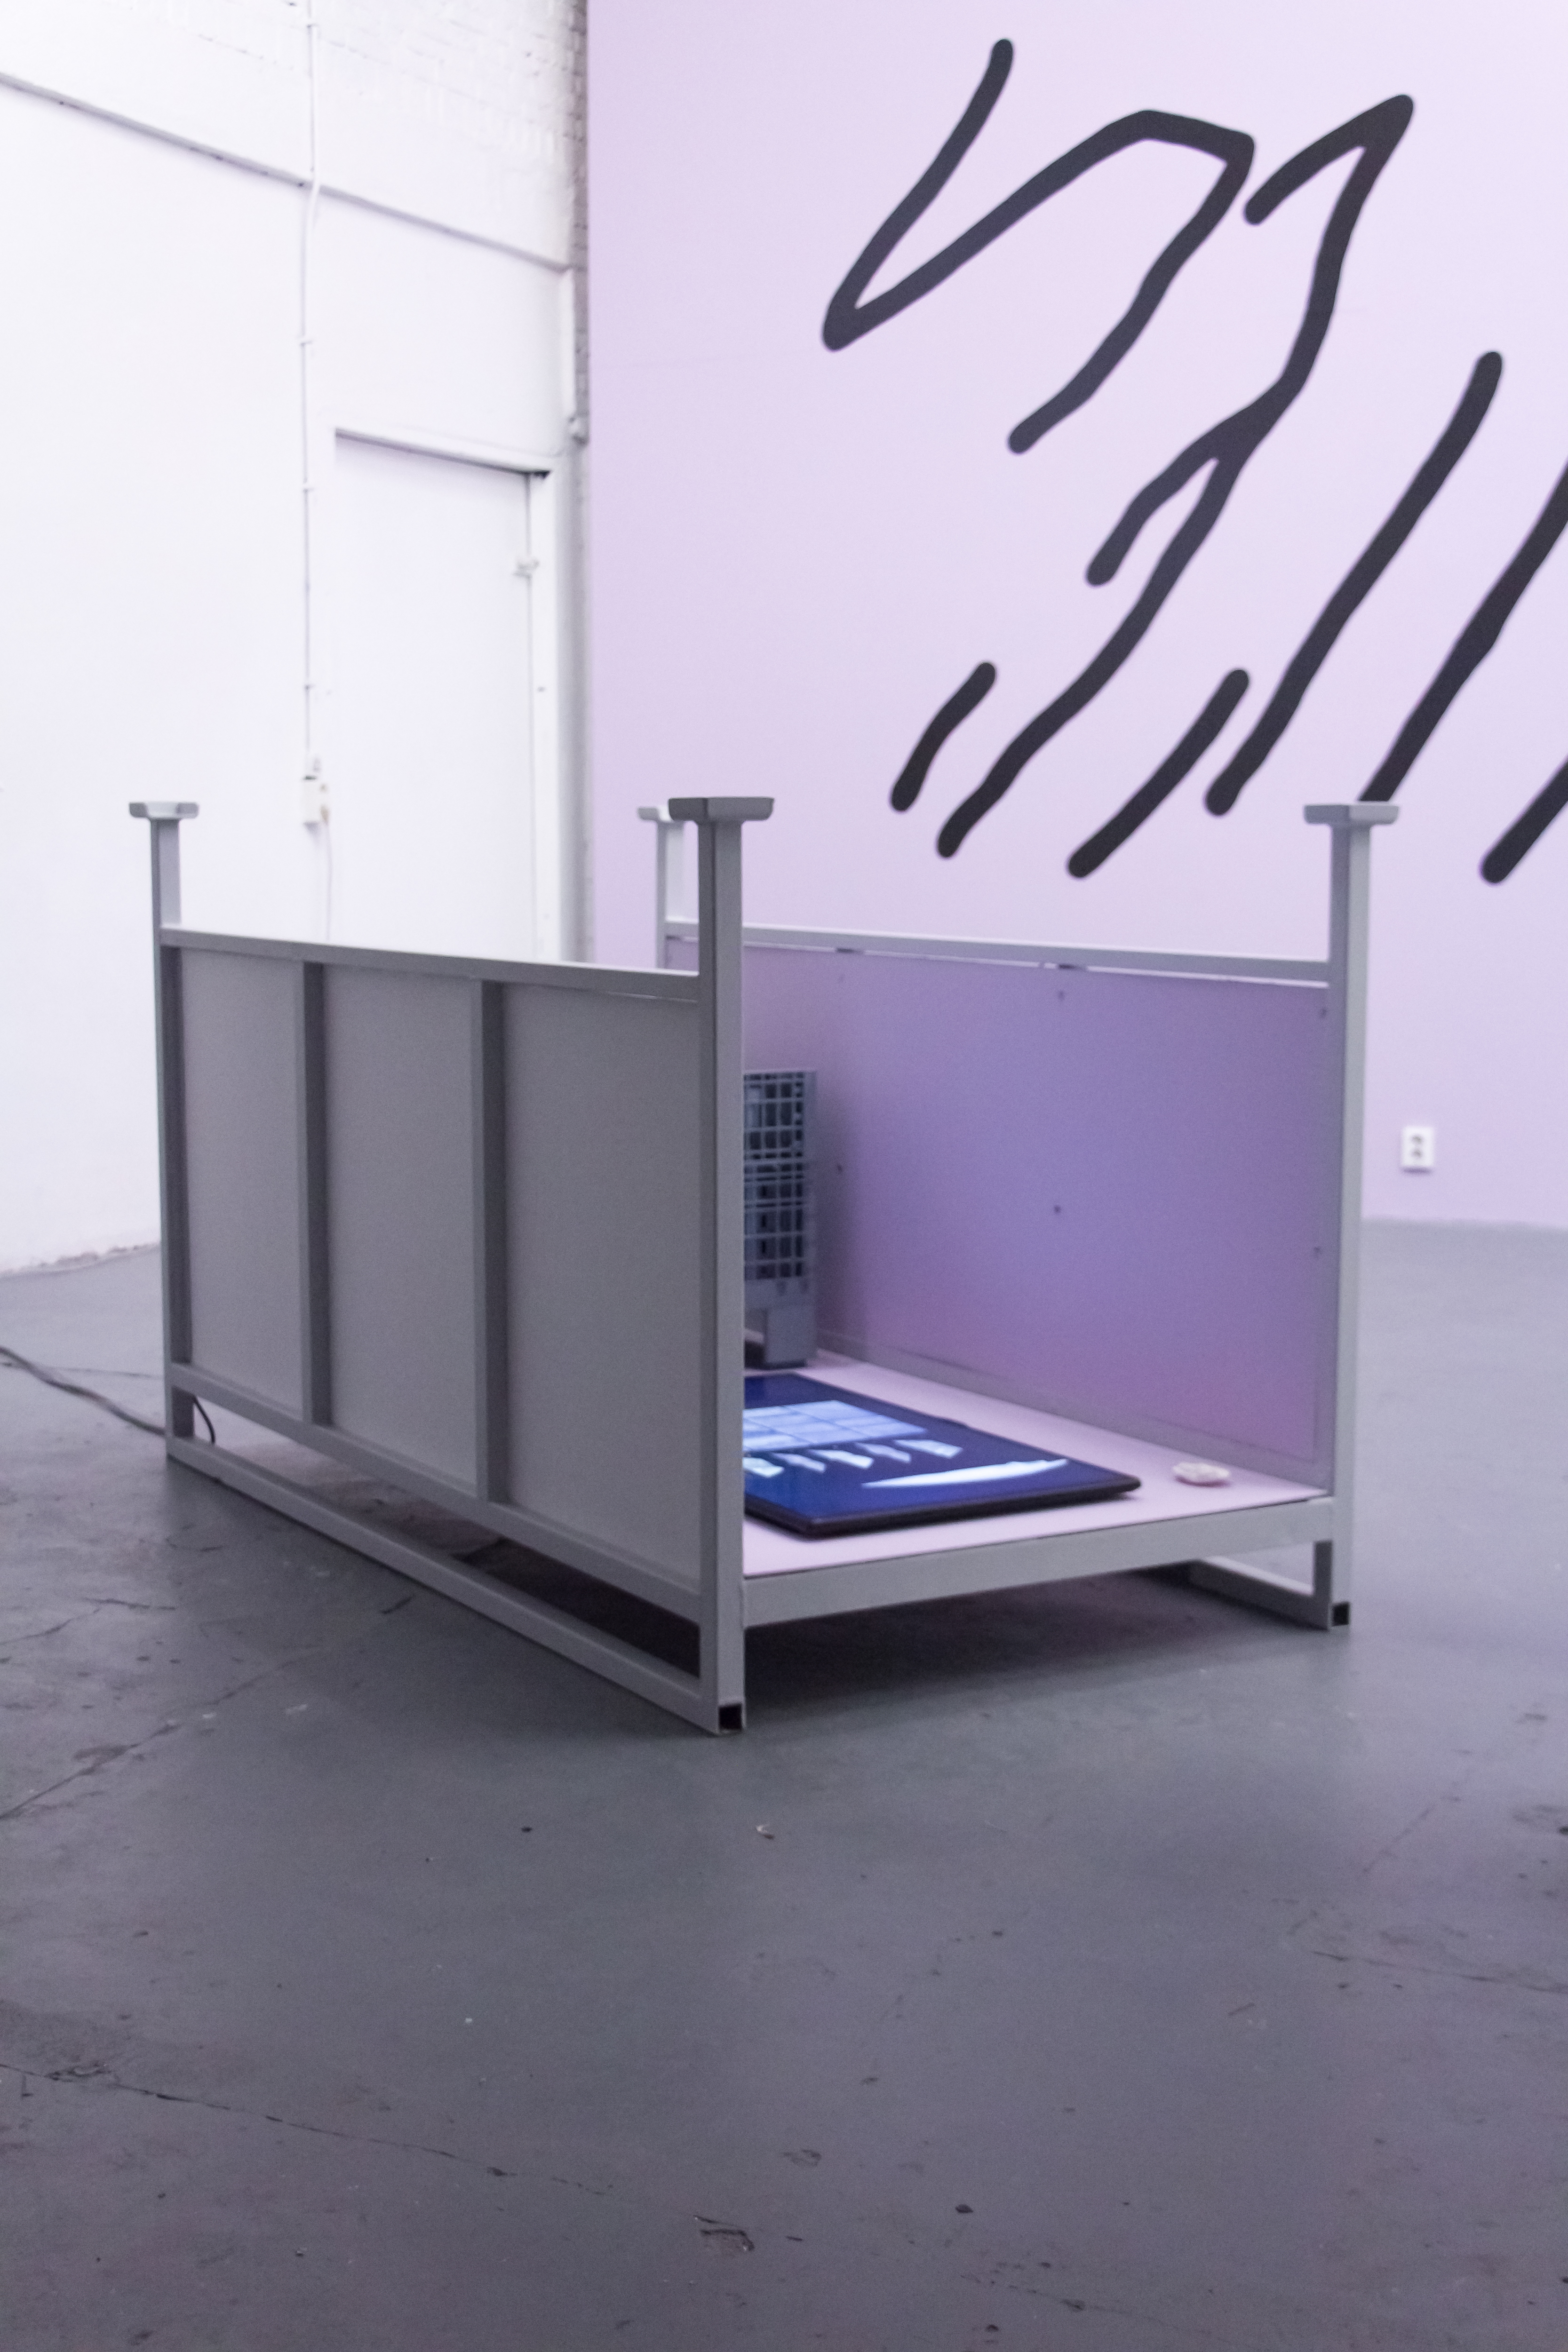
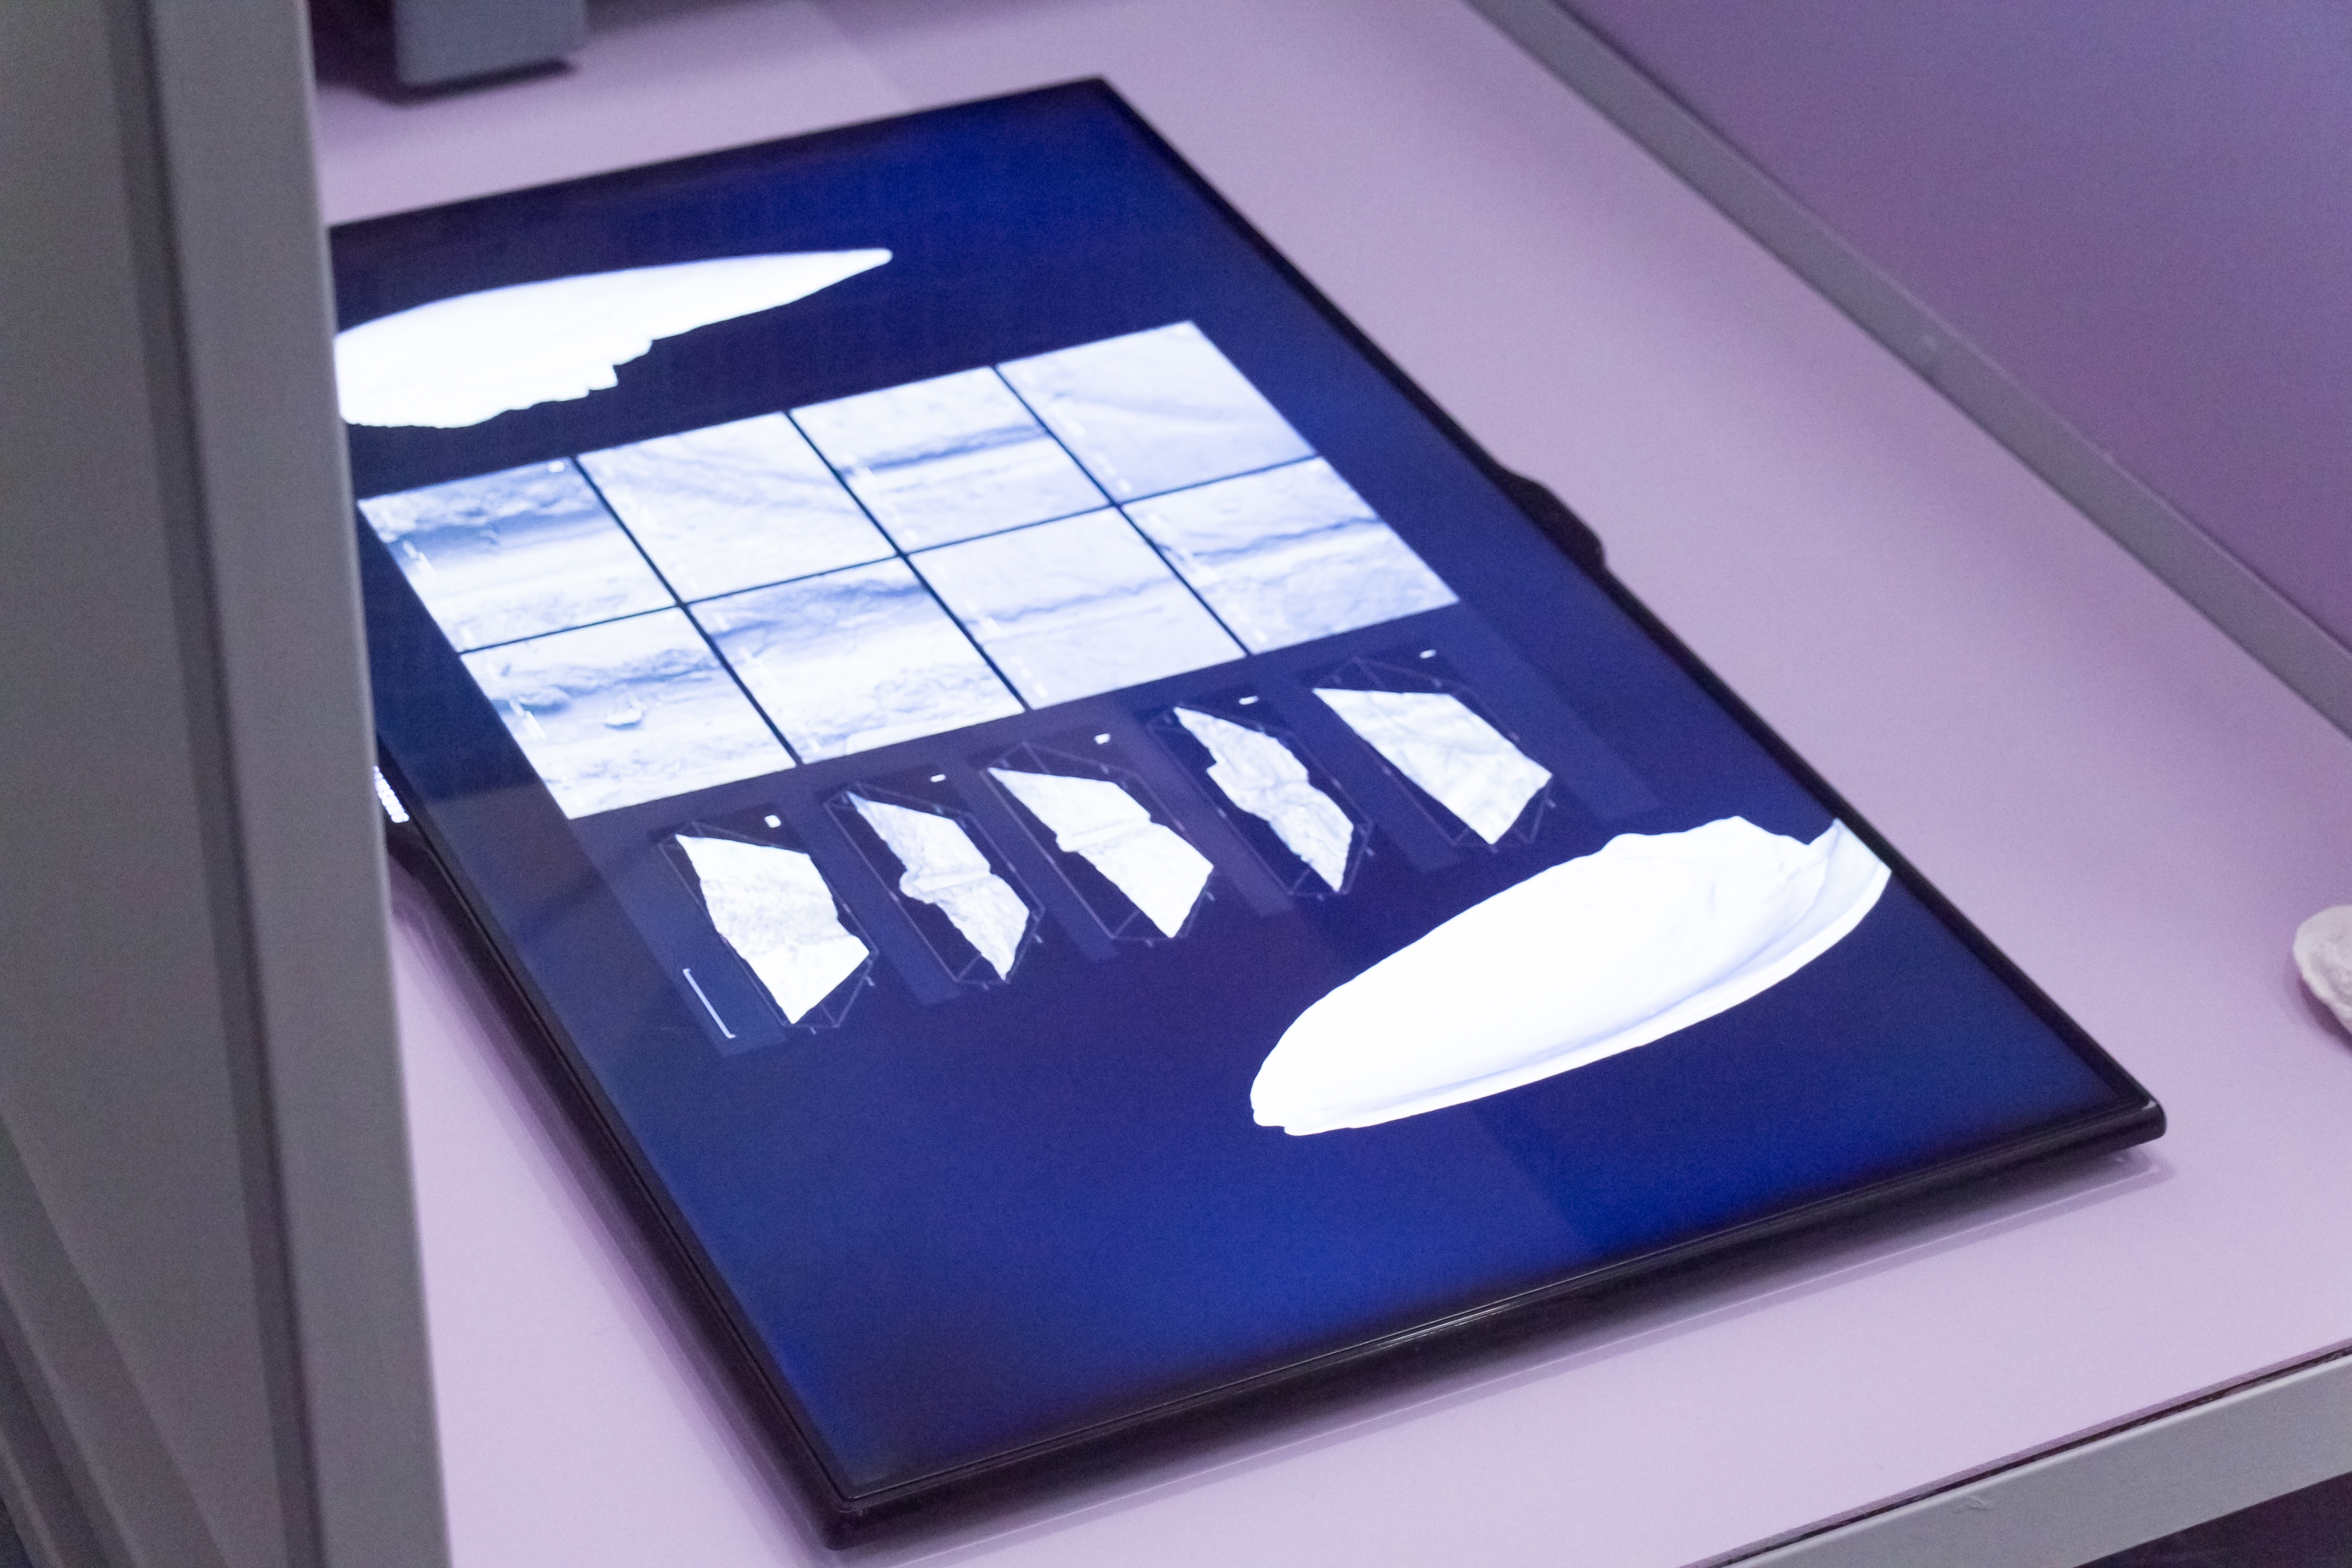
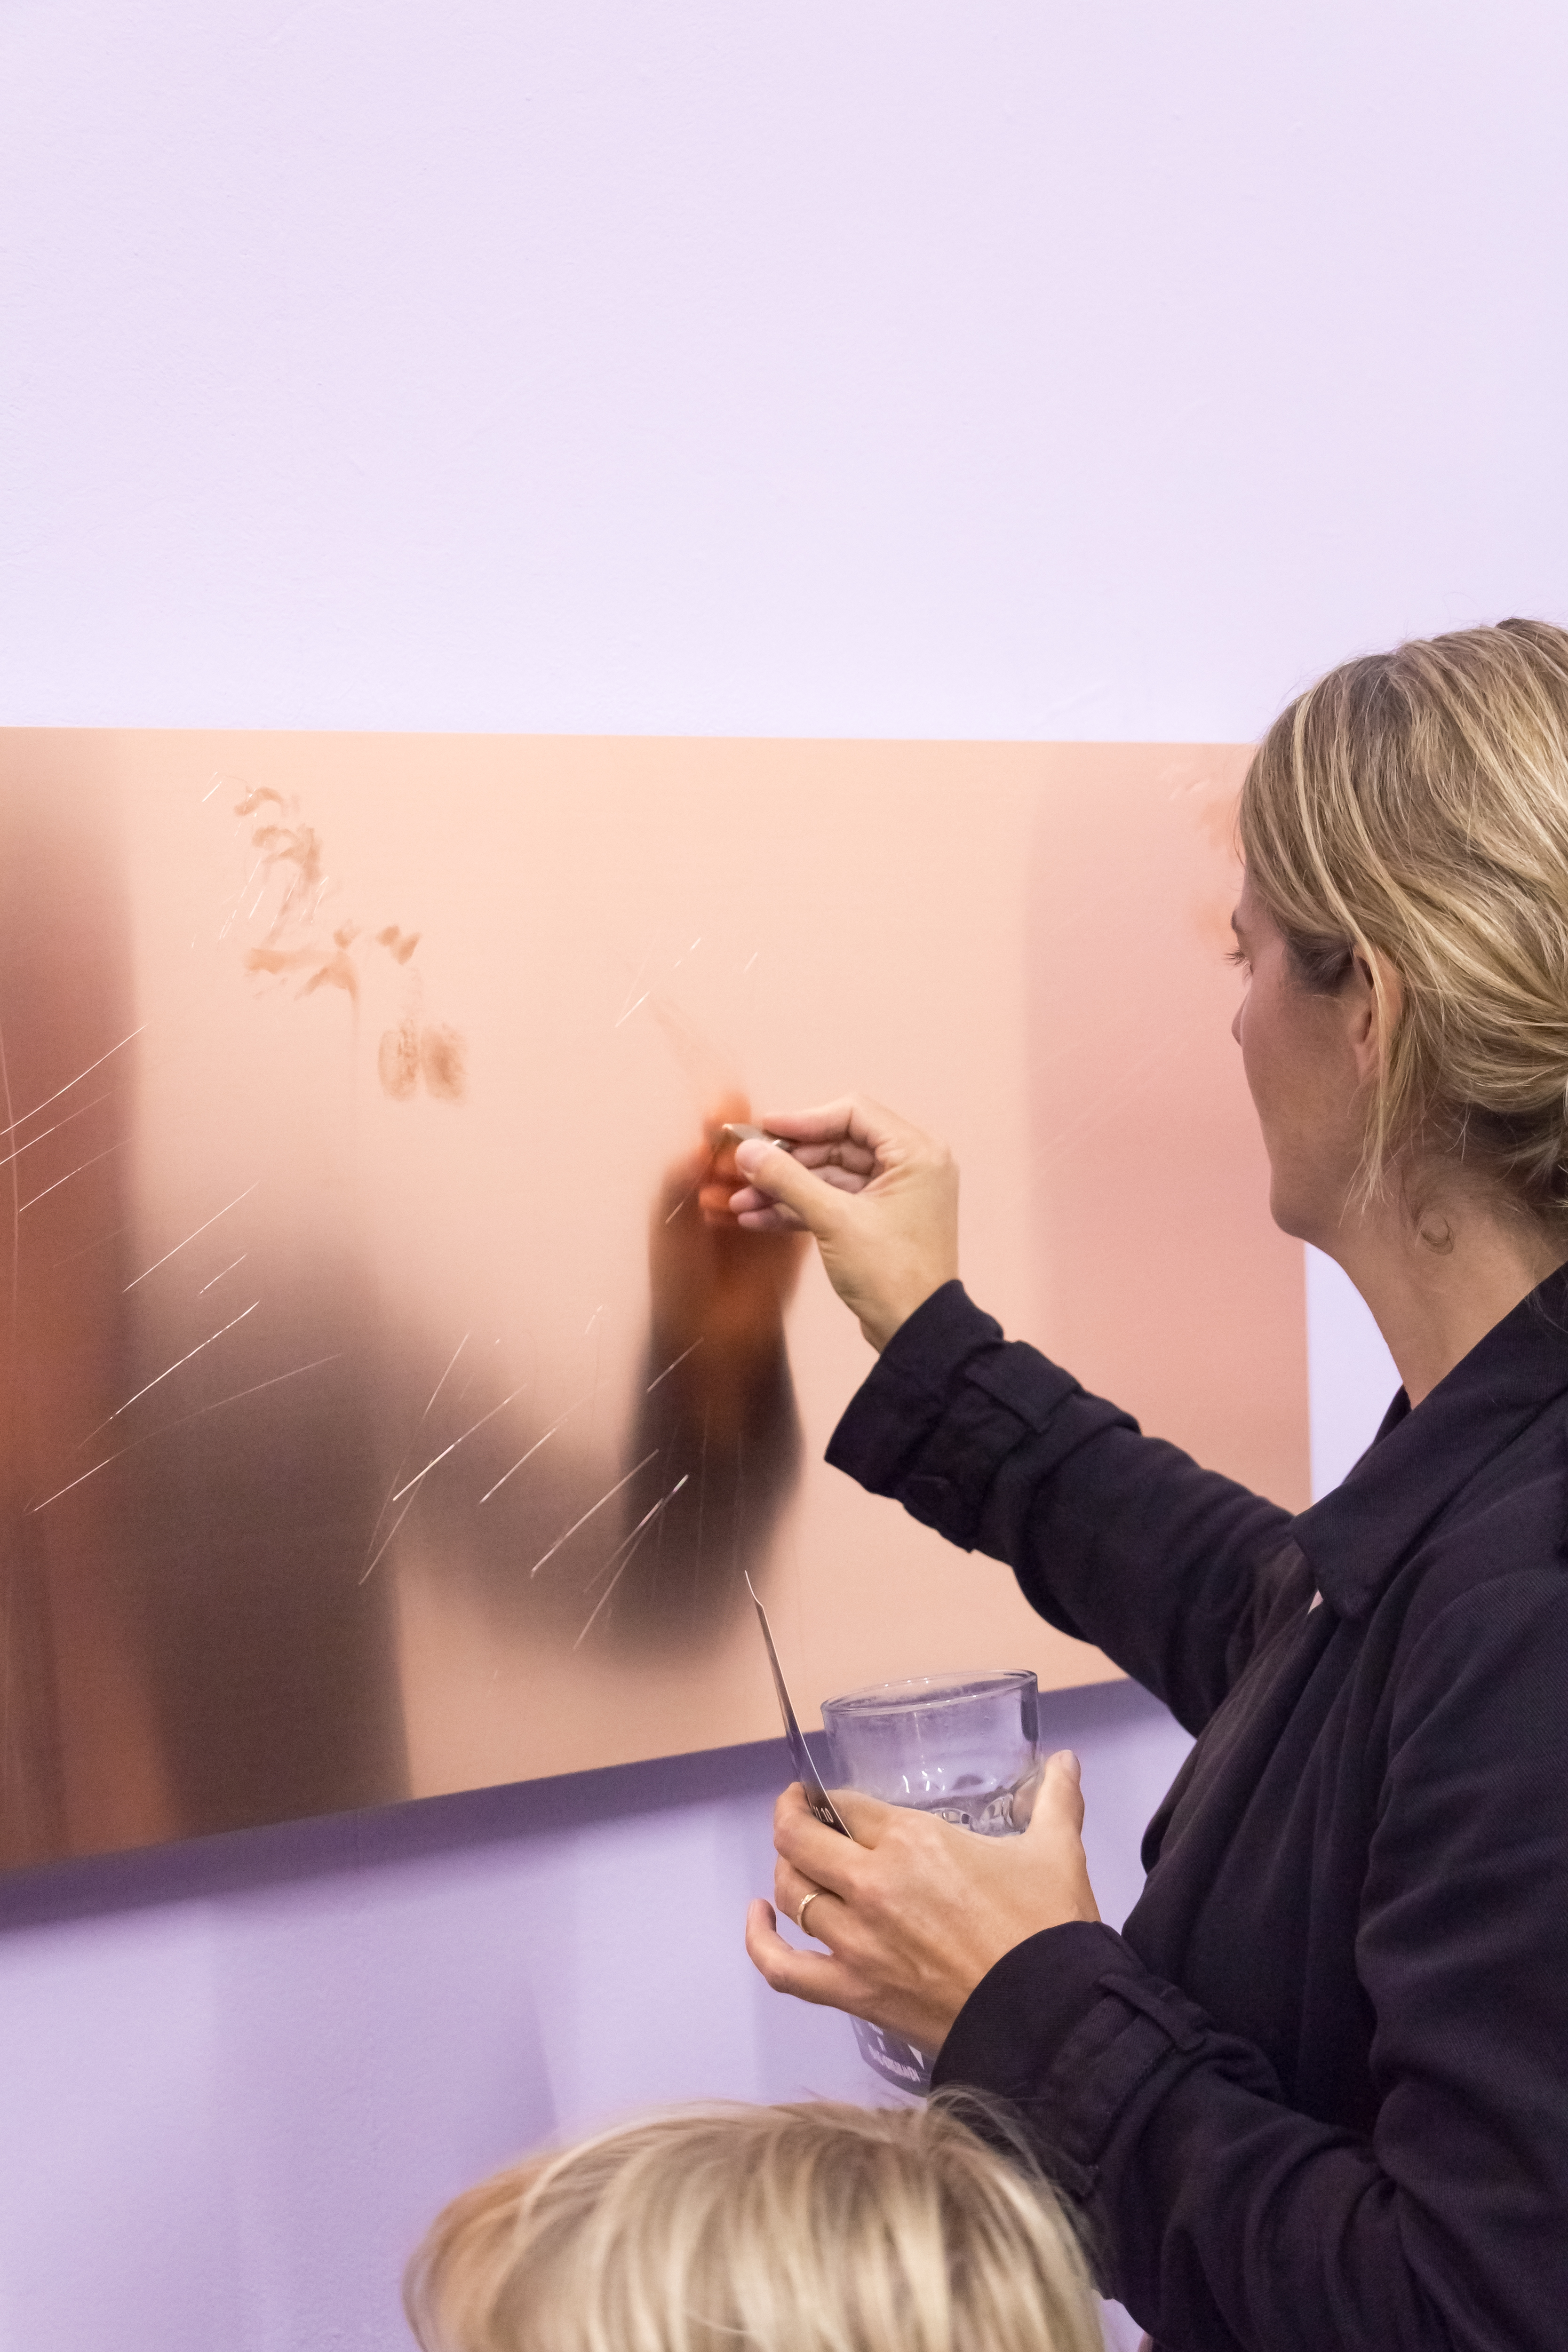
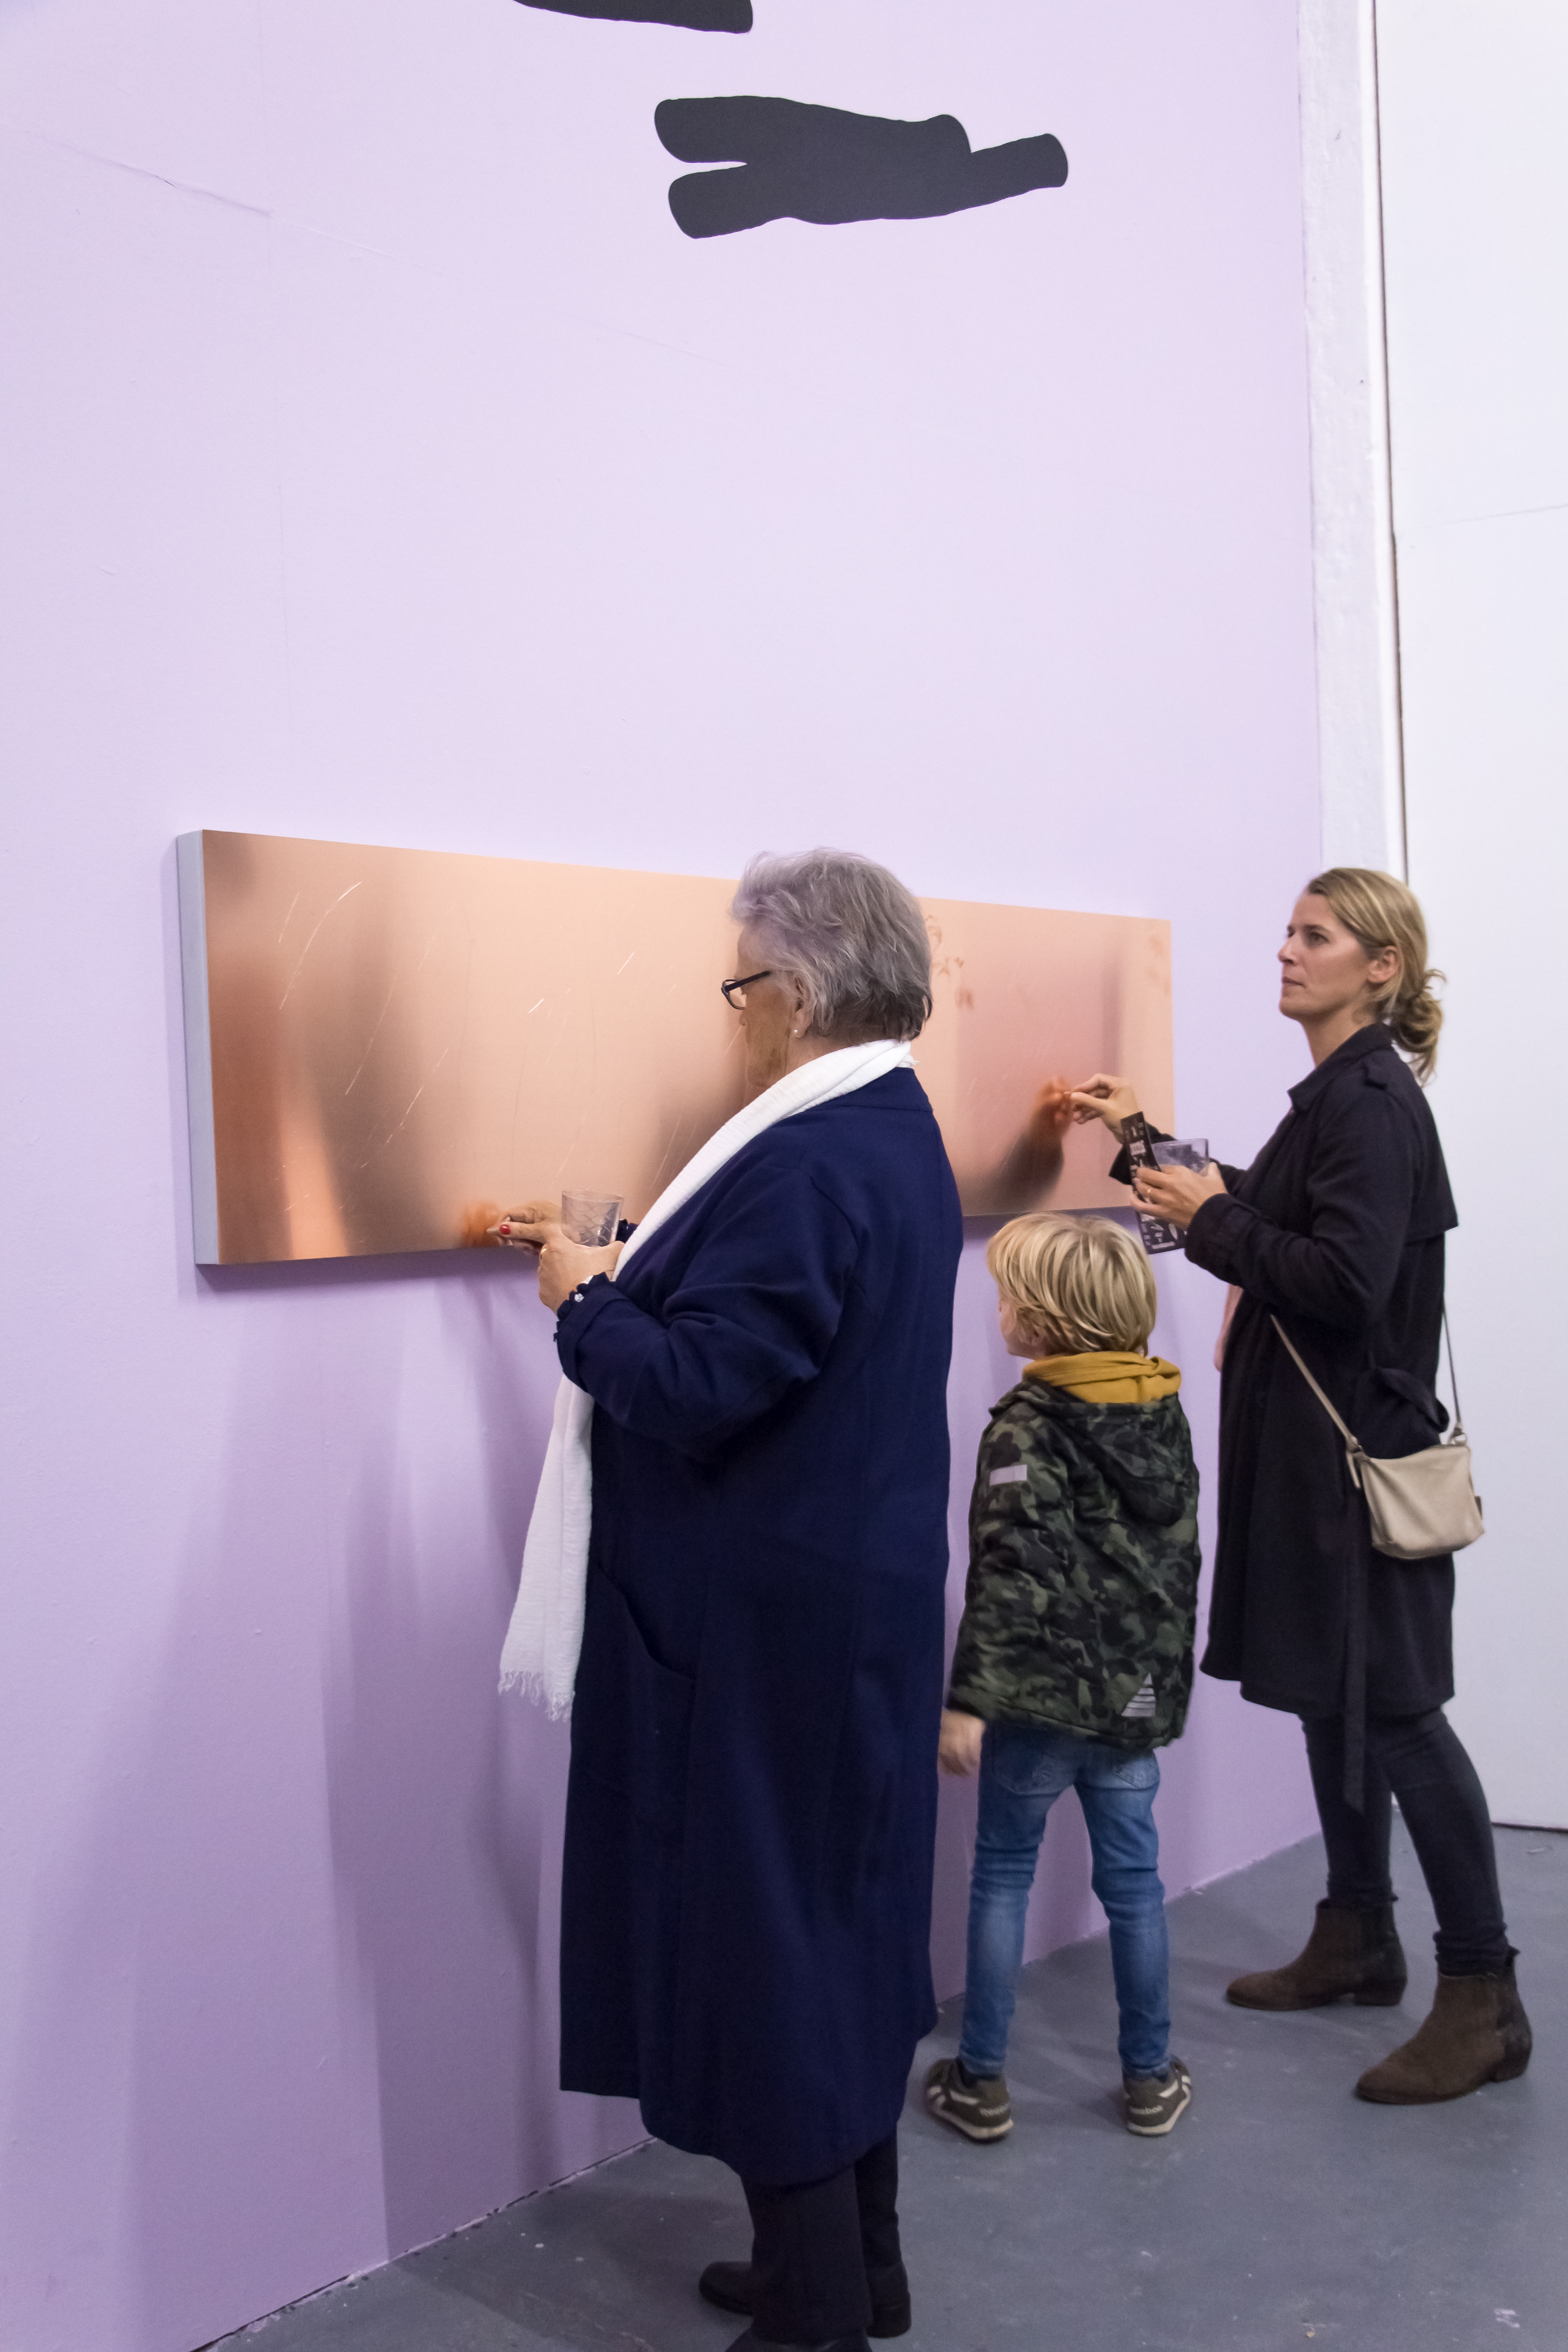
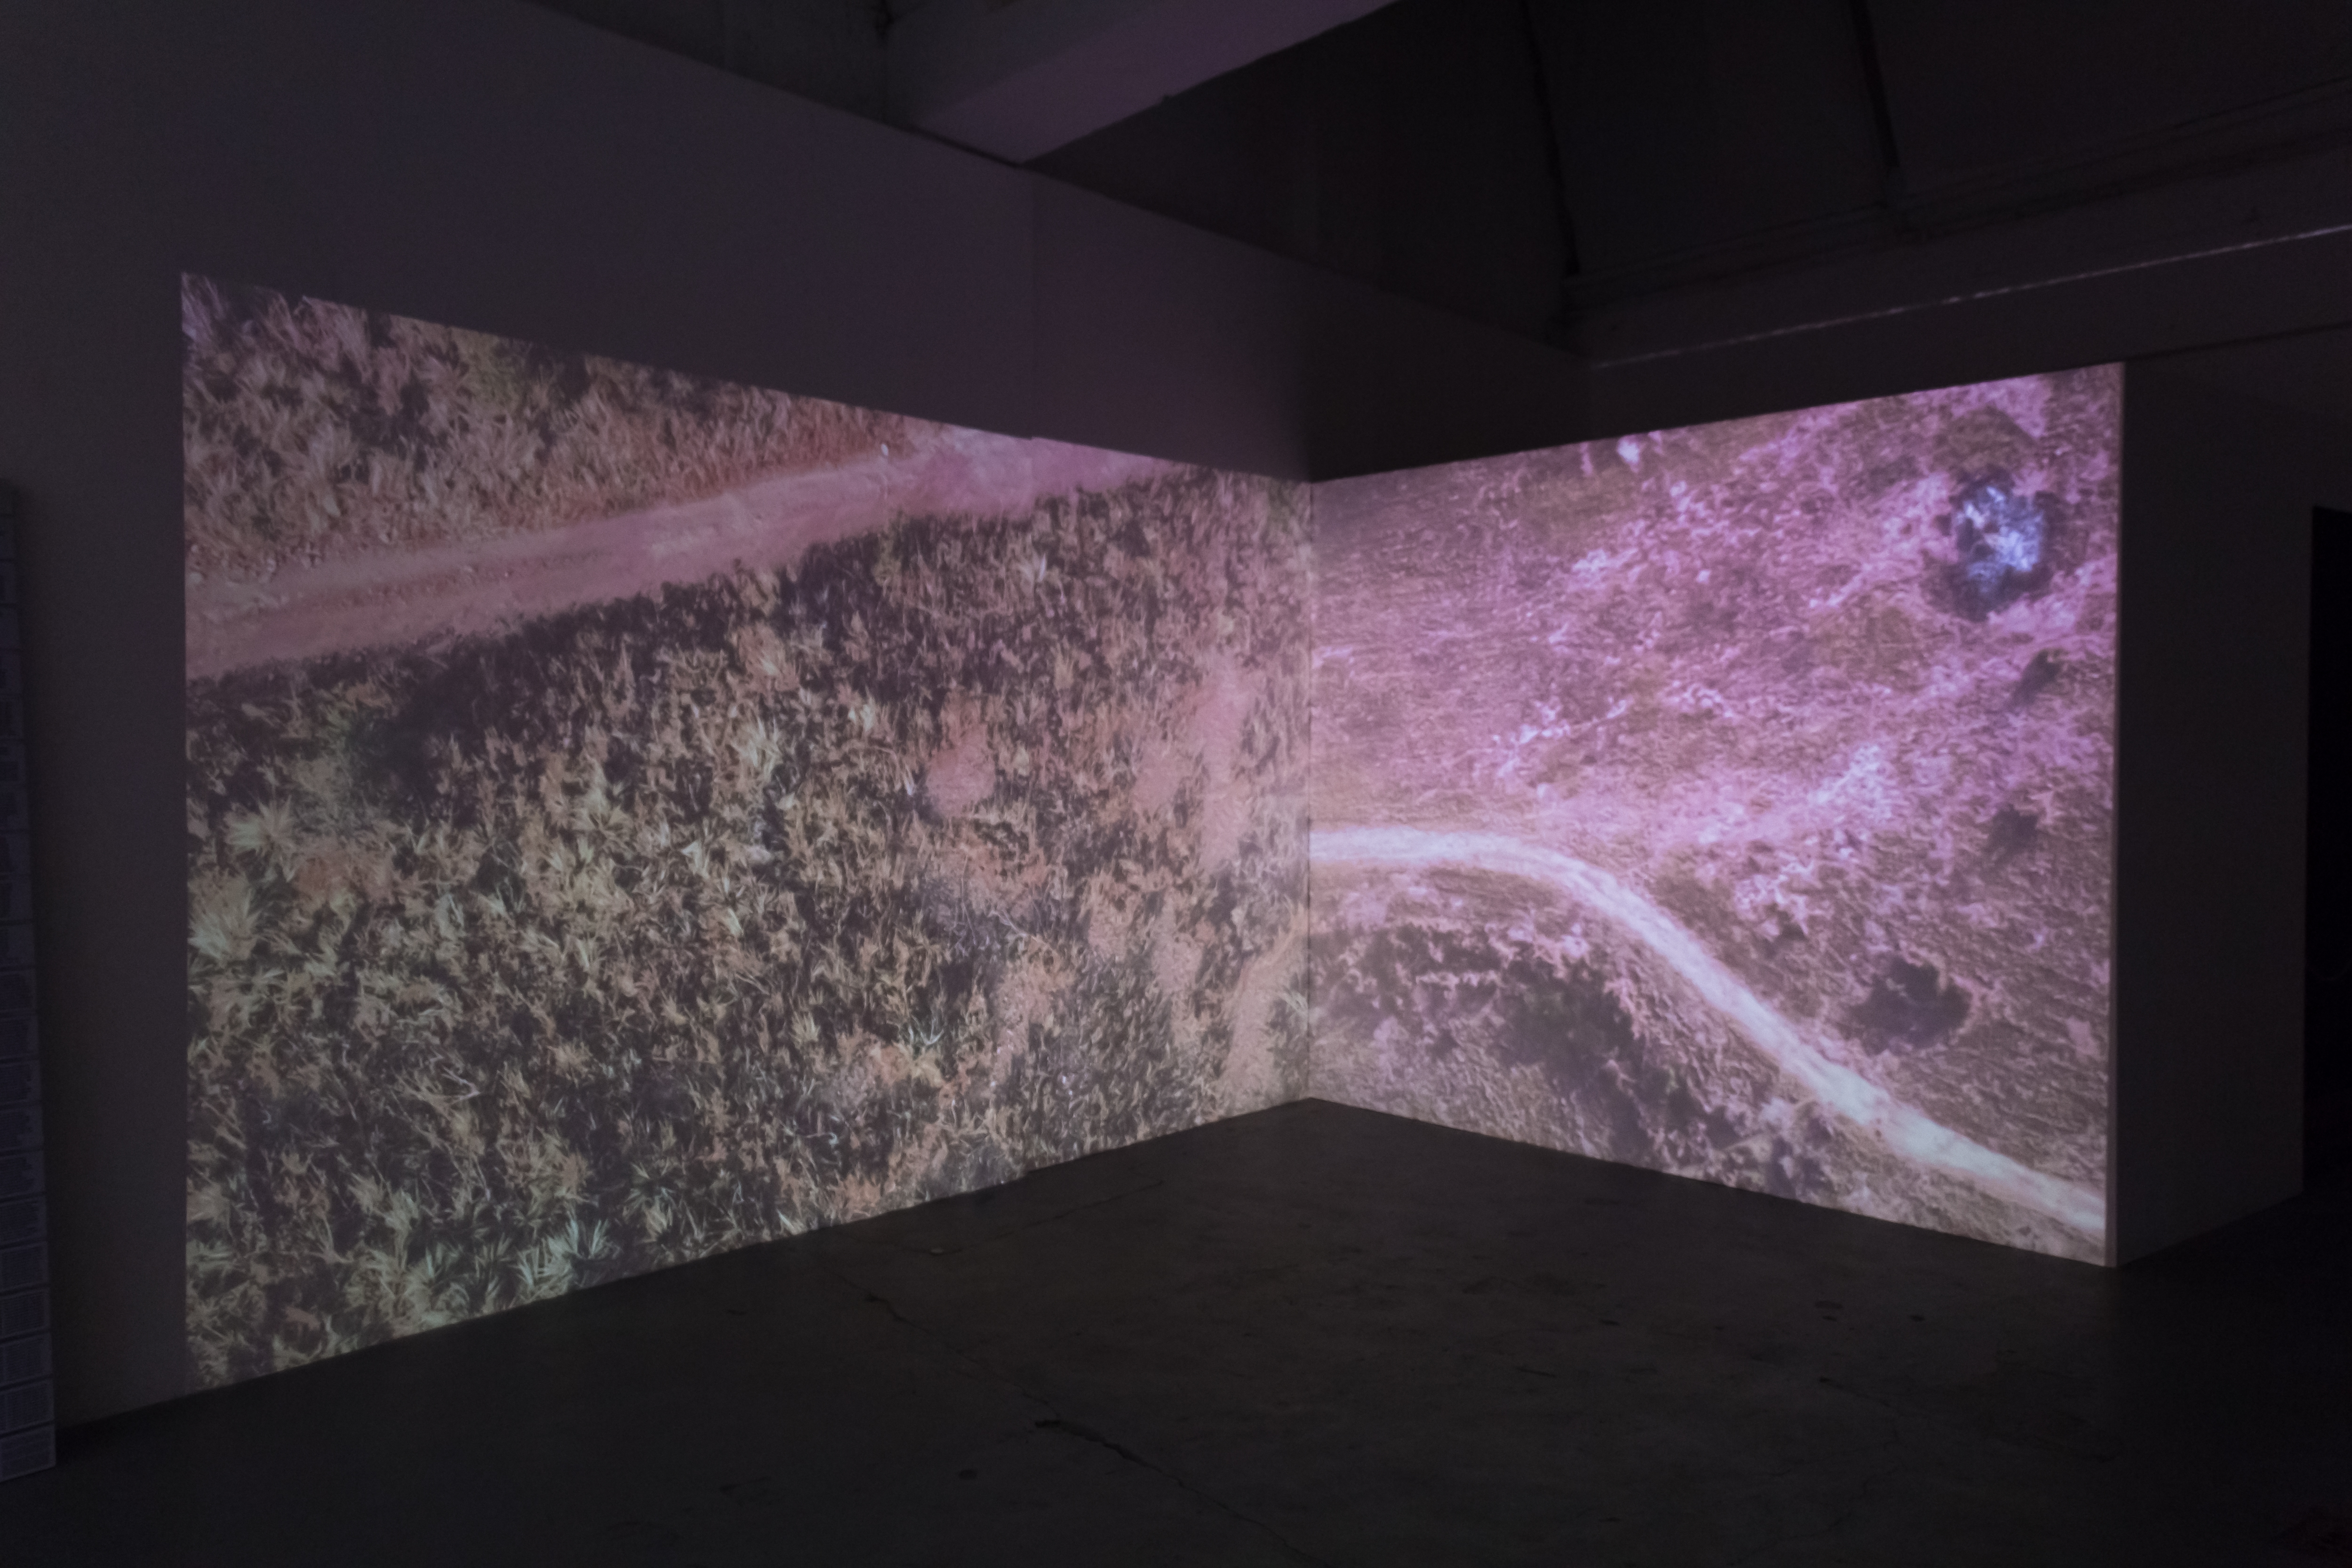
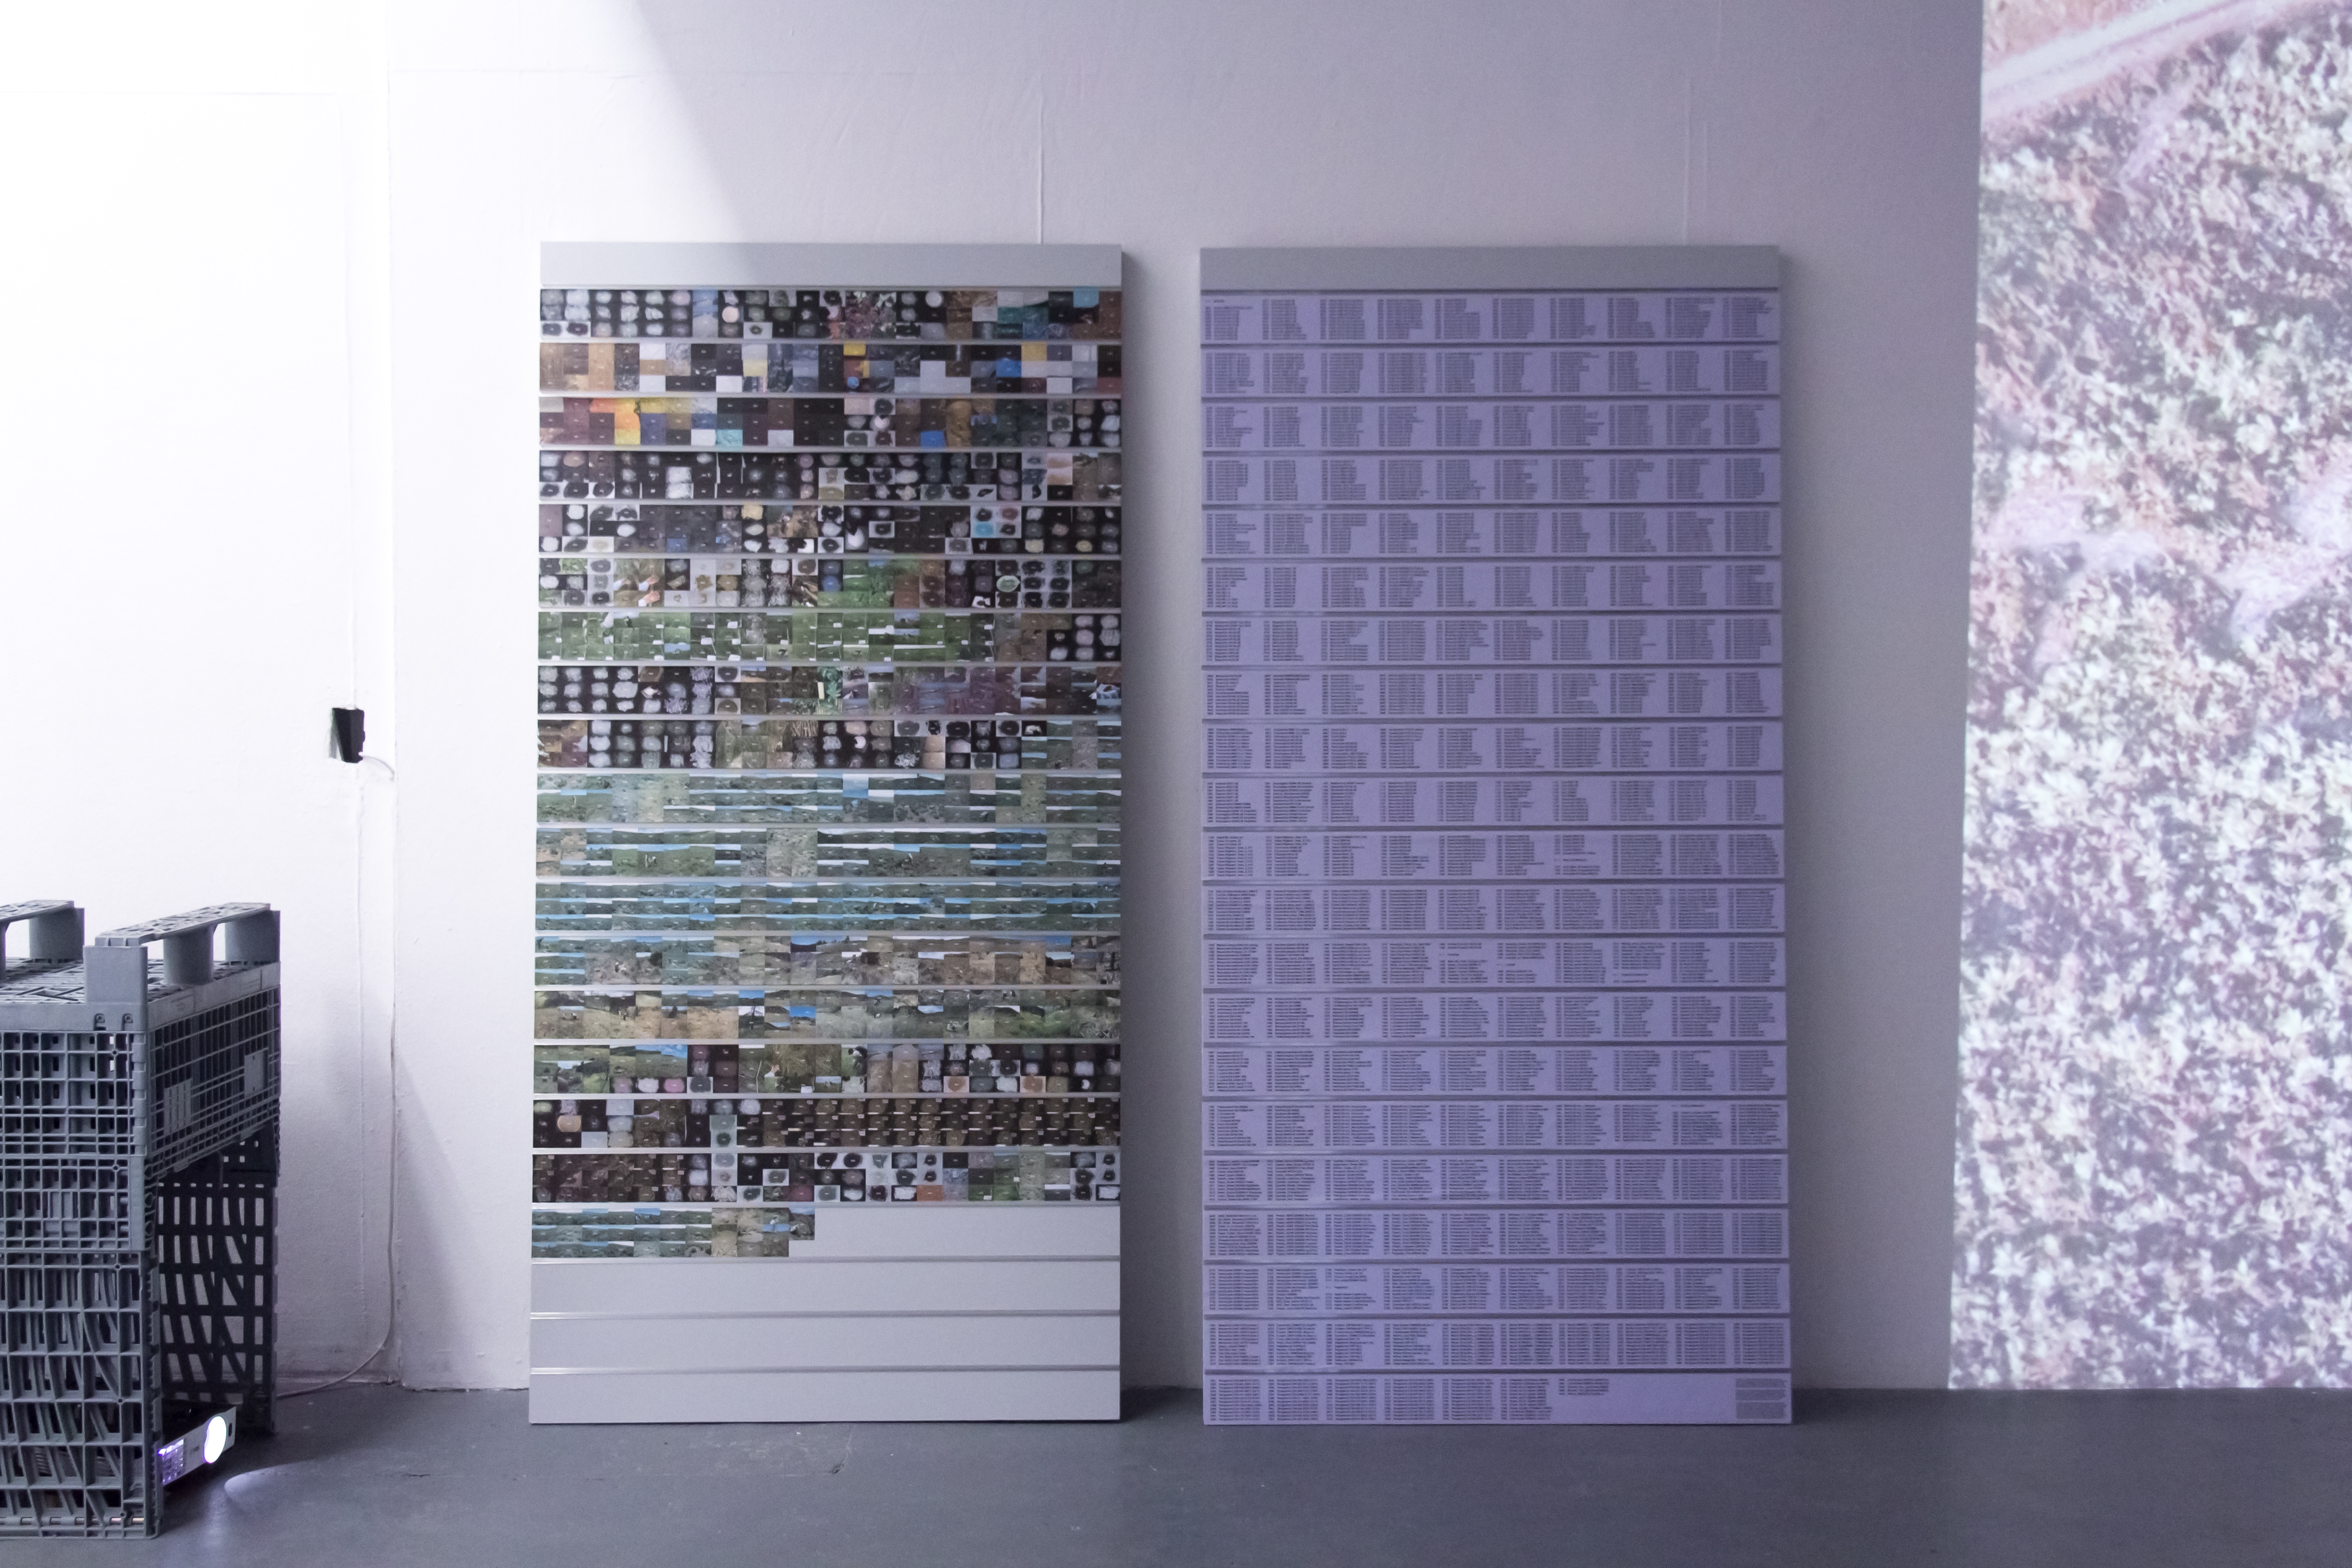
The ways in which nature is abstracted into valuable data is also explored in ‘I see what you don’t see’, consisting of a video work and two wall panels. The work explores how the surface of the earth is continuously scanned by satellites. Changes that emerge in the landscape through fluctuating animal populations, climate, mining, and natural disasters are meticulously monitored and measured. These realtime changes in data create value fluctuations in financial markets and are used by investors use to speculate on future trends in stocks and futures contracts.
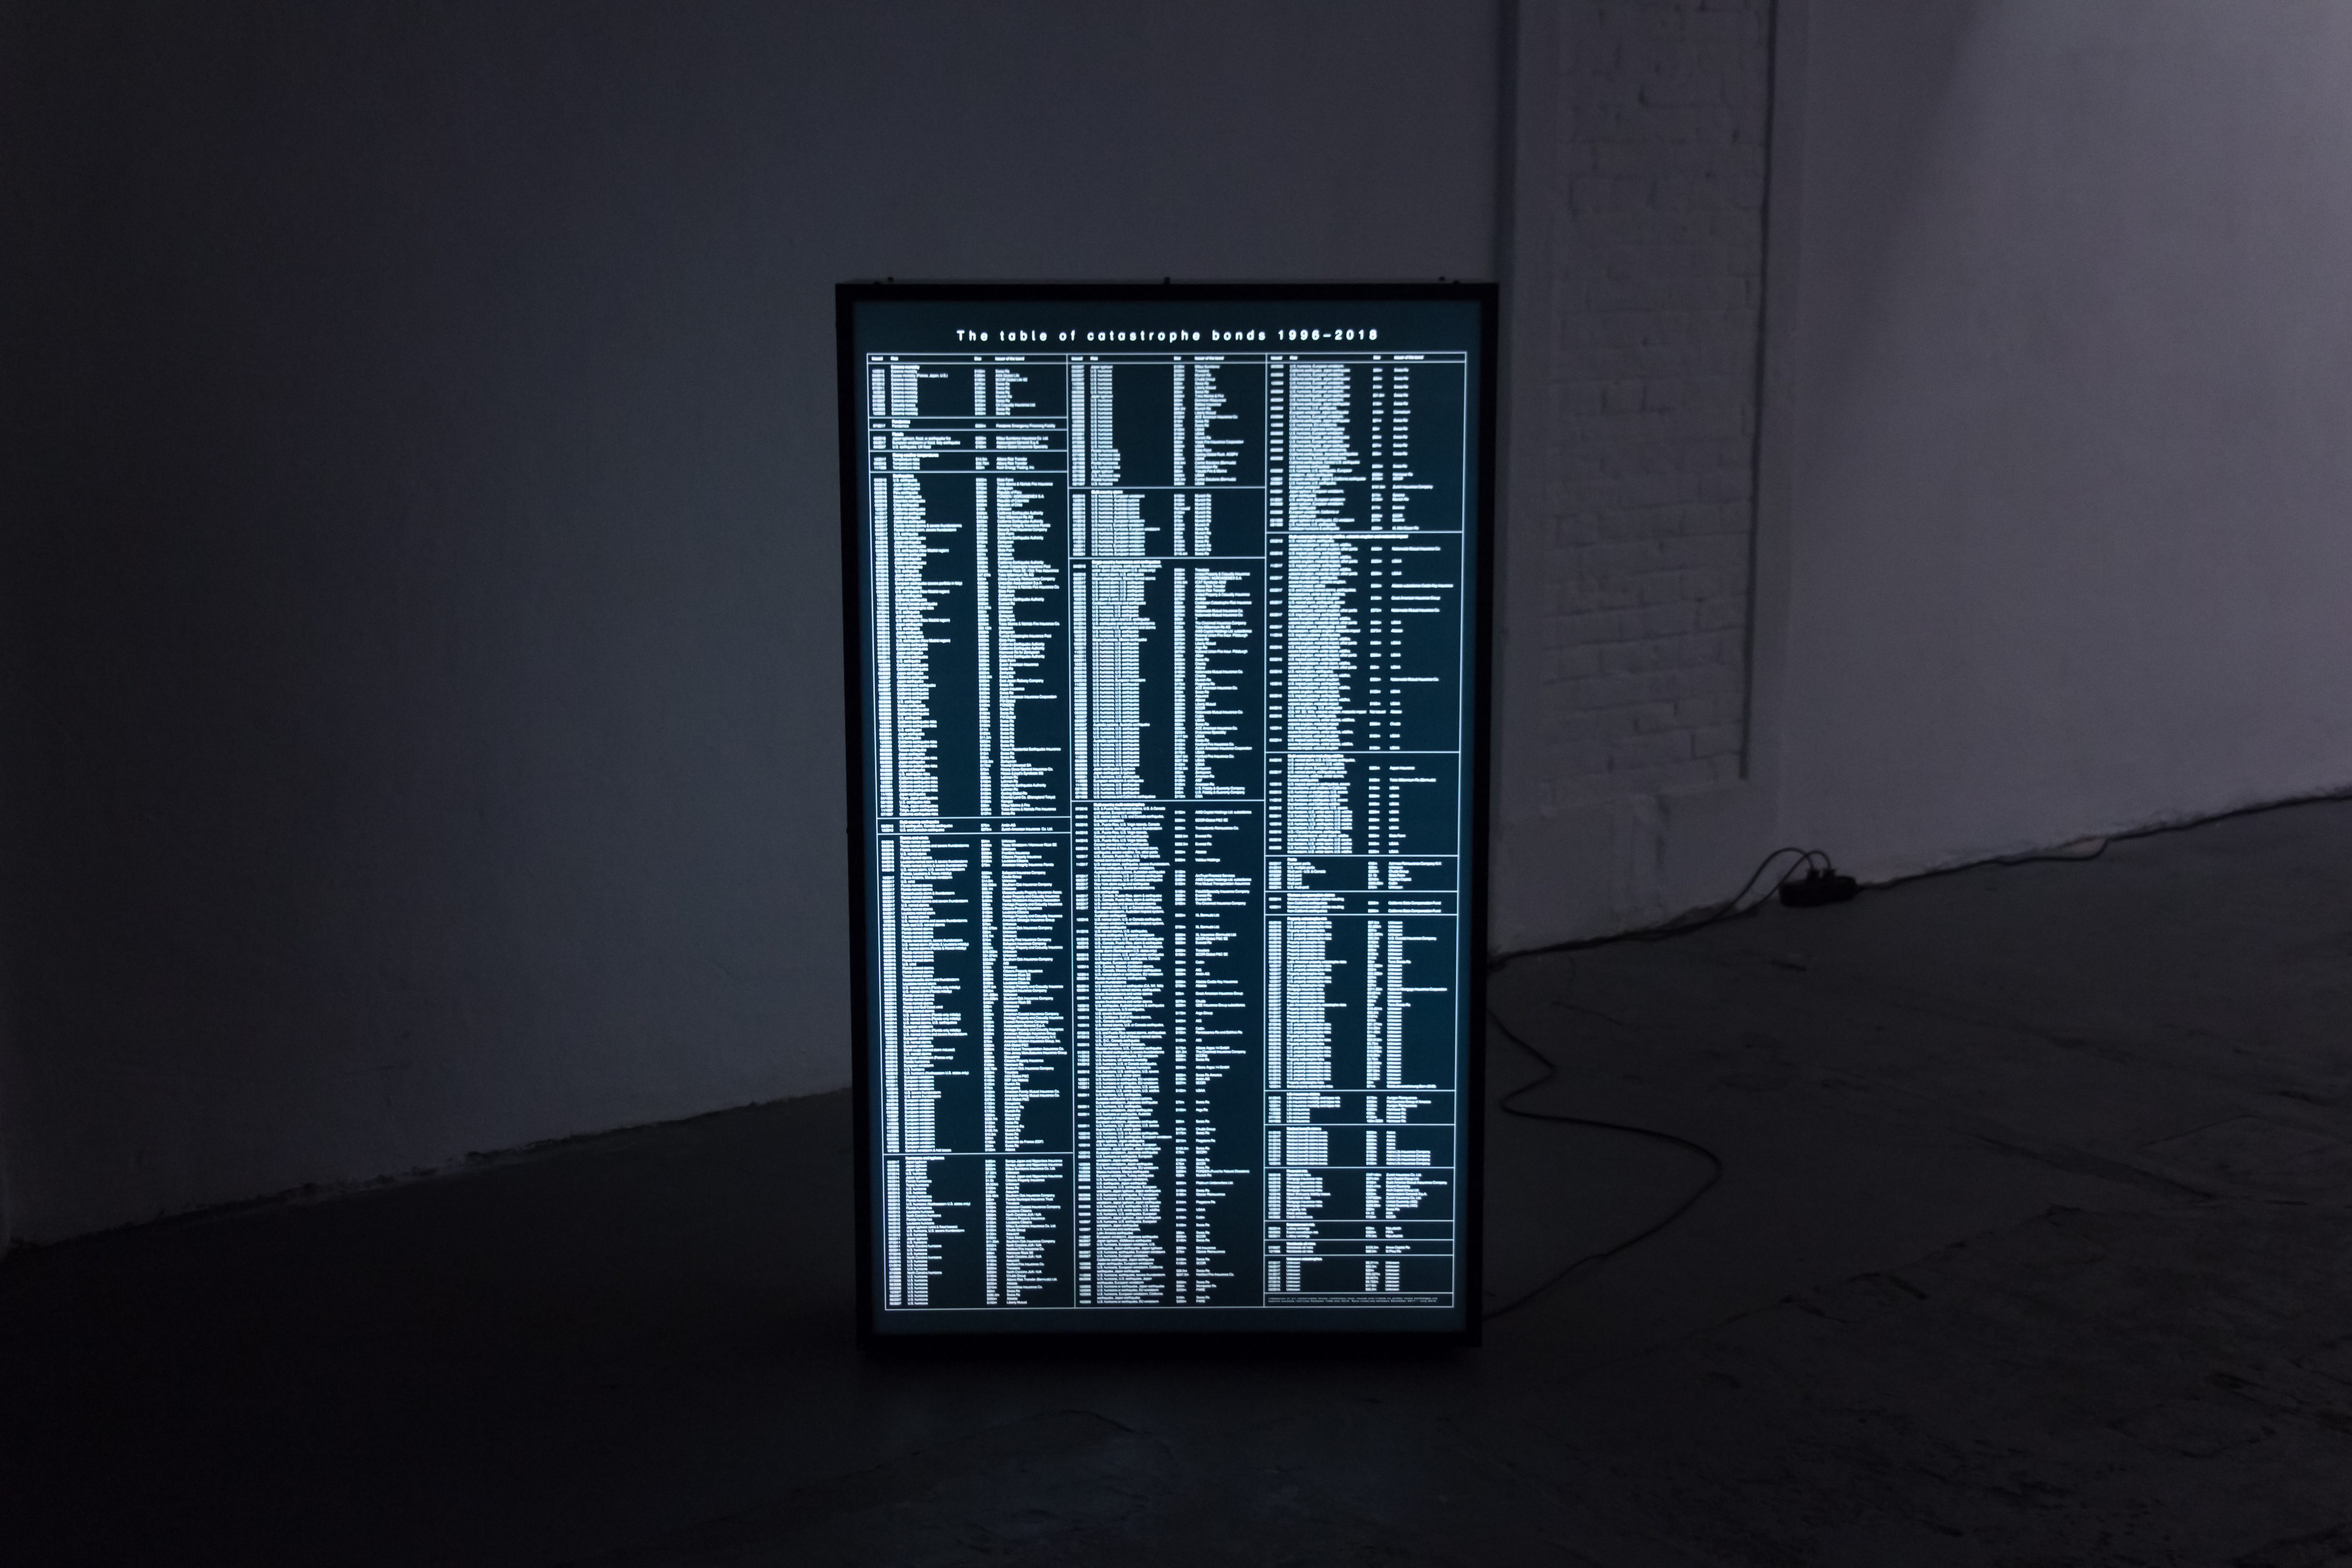
With the double sided light box ‘Corrupted Air’, Herregraven shows that not only current landscapes in motion are subject of speculations, also future transformations of our surroundings are calculated, modelled and traded. Investors speculate through catbonds, short for catastrophe bonds, on future natural disasters and changes in local climates. Herregraven asks with her artistic research what happens to our concept and experience of ‘nature’ when future rivers, hurricanes, forests, earthquakes, and animal populations are reduced to data which is traded on financial markets.
‘A Doodle, A Diagram, A Disaster’ marks Herregraven’s ongoing research into the relation between, ecologie, geology and finance in which the current and future movements of energie are indexed and manipulated by algorithms and machines. What is the role of the human eye and gesture in this indexed ‘natural’ world?
Femke Herregraven (1982, Nijmegen) lives and works in Amsterdam. In 2017 and 2018 she was a resident at the Rijksakademie van beeldende kunsten in Amsterdam. She also nominated for the Prix de Rome.